Page 324 - The Atlas of Economic Complexity
P. 324

MAPPING PATHS TO PROSPERITY  |  325


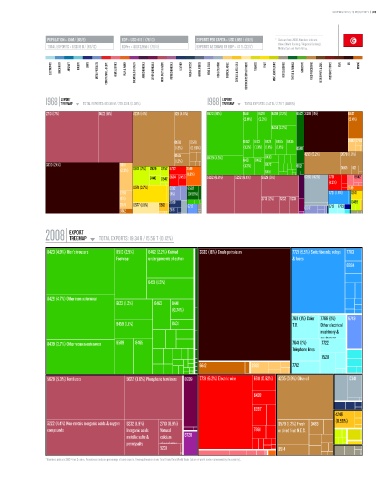
                   POPULATION ≥ 10 M / (69/8)  GDP ≥ USD 41 b / (76/13)   EXPORTS PER CAPITA ≥ USD 1,869 / (61/9)  *   Data are from 2008. Numbers indicate:
                                                                                                          value (World Ranking / Regional Ranking).
                   TOTAL EXPORTS ≥ USD 19 b / (68/12)  GDPpc ≥ USD 3,955 / (78/11)  EXPORTS AS SHARE OF GDP ≥ 47 % (33/7)    Middle East and North Africa.

                    ELECTRONICS  MACHINERY  AIRCRAFT   bOILERS   SHIPS   METAL PRODUCTS  CONSTR. MATL. & EqPT.  HOME & OFFICE  PULP & PAPER  CHEMICALS & HEALTH  AGROCHEMICALS  OTHER CHEMICALS  INOR. SALTS & ACIDS  PETROCHEMICALS  LEATHER  MILK & CHEESE  ANIMAL FIbERS  MEAT & EGGS  FISH & SEAFOOD  TROPICAL AGRIC.  CEREALS & vEG. OILS  COTTON/RICE/SOY & OTHERS  TObACCO  FRUIT  MISC. AGRICULTURE  NOT CLASSIFIED  TEXTILE & FAbRICS  GARMENTS  FOOD PROCESSING  bEER/SPIRITS & CIGS.  PRECIOUS STONES  COAL  OIL  MINING


                        EXPORT                                                      EXPORT
                  1968 TREEMAP  TOTAL EXPORTS: 193.58 M / 228.33 b (0.08%)    1988 TREEMAP  TOTAL EXPORTS: 2.47 b / 2.79 T (0.09%)
                                        Total Exports: 193.58 M / 228.33 B (0.08%)                   Total Exports: 2.47 B / 2.79 T (0.09%)
                  2713 (17%)          5622 (11%)   4235 (14%)     1121 (4.8%)  8423 (10%)   8441  8429  8459 (2.2%)  6522 3330 (11%)  6612
                                                                                            (2.6%)  (2.3%)                         (2.4%)
                                                                                                      8434 (2.2%)

                                                                  0565  0579                8452 6123  8424  8465 8435             2882 2783
                                                                  (1.3%)  (0.86%)           (1.3%) (1.3%) (1.1%) (1.1%)  6592
                                                                  0545        8439 (4.5%)           8433          4235 (5.2%)   0579 (1.9%)
                                                                  (1.3%)                    8431  8462
                  3330 (24%)                  6851                                          (1.3%)  8472       6521             0565  1121
                                              (2.3%)  0812 (2%) 2929 0752 6732  2519                8451
                                                                       (1.8%)
                                                         2440  0542  6624 2450  5622 (6.8%)  5222 (6.4%)  5629 (5%)  0360 (4.2%)  7731  8842
                                                                                                                           (1.3%)
                                                   0571 (3.7%)  0012   6592                                                       2519
                                              2783              (1%)   (0.99%)                                             7721 (1.8%)  0571
                                              (1%)                                                2713 (2%)  5232 5231
                                              2875  0577 (1.8%)  5513  2919  6712                                 0012     7712 7723  0488
                                              6612              2116


                           EXPORT
                  2008 TREEMAP        TOTAL EXPORTS: 19.34 b / 15.56 T (0.12%)
                                                                 Total Exports: 19.34 B / 15.56 T (0.12%)
                   8423 (4.9%) Men's trousers  8510 (2.5%)  8462 (2.2%) Knitted  3330 (16%) Crude petroleum   7721 (5.5%) Switchboards, relays  7783
                                            Footwear    undergarments of cotton                               & fuses
                                                                                                                                  6994


                                                        8451 (1.5%)


                   8429 (4.7%) Other men outerwear
                                            6123 (1.2%)   8463   8441
                                                                 (0.74%)
                                                                                                              7611 (1%) Color  7788 (1%)  6749
                                            8459 (1.1%)          8431                                         T.V.      Other electrical
                                                                                                                        machinery &
                                                                                                                        equipment
                                                                                                                         7722
                   8439 (3.7%) Other women outerwear  6589  8465                                              7641 (1%)  N.E.S.
                                                                                                              Telephone lines
                                                                                                                         7528
                                                                           6612                2882           7712


                   5629 (5.3%) Fertilizers      5622 (3.9%) Phosphatic fertilizers  8939  7731 (6.2%) Electric wire  6911 (0.62%) 4235 (3.9%) Olive oil  0341

                                                                                               6428

                                                                                               6997
                                                                                                                              4249
                   5222 (4.4%) Non-metals inorganic acids & oxygen  5232 (1.9%)  2713 (0.9%)             0579 (1.2%) Fresh  0483  (0.59%)
                   compounds                    Inorganic acids  Natural                       7861      or dried fruit N.E.S.
                                                metallic salts &  calcium  8720
                                                peroxysalts  phosphates
                                                             5231                                        0914
                                                             & aluminium
                  * Numbers indicate SITC-4 rev 2 codes. Parenthesis indicate percentage of total exports. Treemap Headers show: Total Trade/Total World Trade (share of world trade represented by the country).
   319   320   321   322   323   324   325   326   327   328   329