
Page 326 - The Atlas of Economic Complexity
P. 326
MAPPING PATHS TO PROSPERITY | 327
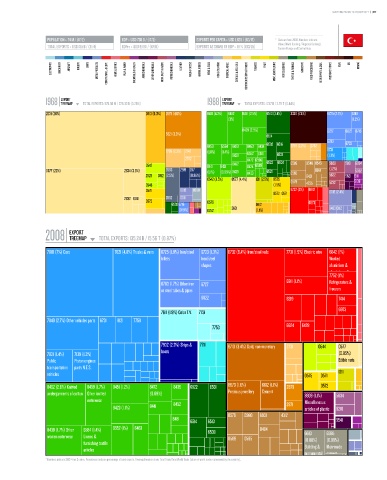
POPULATION ≥ 74 M / (17/2) GDP ≥ USD 730 b / (17/2) EXPORTS PER CAPITA ≥ USD 1,826 / (63/17) * Data are from 2008. Numbers indicate:
value (World Ranking / Regional Ranking).
TOTAL EXPORTS ≥ USD 135 b / (31/4) GDPpc ≥ USD 9,881 / (47/11) EXPORTS AS SHARE OF GDP ≥ 18 % (103/25) Eastern Europe and Central Asia.
ELECTRONICS MACHINERY AIRCRAFT bOILERS SHIPS METAL PRODUCTS CONSTR. MATL. & EqPT. HOME & OFFICE PULP & PAPER CHEMICALS & HEALTH AGROCHEMICALS OTHER CHEMICALS INOR. SALTS & ACIDS PETROCHEMICALS LEATHER MILK & CHEESE ANIMAL FIbERS MEAT & EGGS FISH & SEAFOOD TROPICAL AGRIC. CEREALS & vEG. OILS COTTON/RICE/SOY & OTHERS TObACCO FRUIT MISC. AGRICULTURE NOT CLASSIFIED TEXTILE & FAbRICS GARMENTS FOOD PROCESSING bEER/SPIRITS & CIGS. PRECIOUS STONES COAL OIL MINING
EXPORT EXPORT
1968 TREEMAP TOTAL EXPORTS: 576.56 M / 228.33 b (0.25%) 1988 TREEMAP TOTAL EXPORTS: 12.17 b / 2.79 T (0.44%)
Total Exports: 576.56 M / 228.33 B (0.25%) Total Exports: 12.17 B / 2.79 T (0.44%)
2631 (36%) 0813 (6.3%) 2879 (4.6%) 8481 (4.3%) 8462 8451 (2.5%) 6513 (3.4%) 3330 (7.4%) 6725 (2.7%) 6749
(3%) (1.2%)
8439 (2.5%) 6727 6822 6716
6821 (3.9%) 6514
6783
6592 6516 6733
8459 6584 8423 8463 8434 2789 (2.2%) 2782
2789 (2.3%) 2742 (1.8%) (1.4%) 6731
8429 6552 6581 6531 (1.3%)
2782 8472 6596
0542 8441 8431 8452 8424 6589 6522 6534 0589 0546 0545 5629 5831 5834
0577 (22%) 2634 (3.8%) 2683 2919 2117 (1.1%) (0.95%) 8435 8433 6521 0565 0914 (1.2%) 5832
2929 0812 (2.5%) (0.86%) 6421 5622 5621 5111
0542 (3.5%) 0577 (4.4%) 1211 (2.5%) 0575 0579 5138
0548 (1.5%) 4235 5232
0571 0012 0360 6732 (3%) 6842 0012 (2.4%)
0572 0571
2632 0741 2682 0011
0572 0576 6973
65926716 0412
(0.81%) 0752 2631 (1.1%) 8483 0112
EXPORT
2008 TREEMAP TOTAL EXPORTS: 135.24 b / 15.56 T (0.87%)
Total Exports: 135.24 B / 15.56 T (0.87%)
7810 (7%) Cars 7821 (4.8%) Trucks & vans 6725 (1.9%) Iron/steel 6733 (1.3%) 6732 (8.4%) Iron/steel rods 7731 (1.9%) Electric wire 6842 (1%)
billets Iron/steel Worked
shapes aluminium &
aluminium alloys
7752 (1%)
6911 (1.1%) Refrigerators &
6783 (1.7%) Other iron 6727
or steel tubes & pipes freezers
6822 8219 7414
6973
7611 (1.9%) Color T.V. 7751
7849 (2.7%) Other vehicles parts 6731 8121 7758
7753 6624 6428
7932 (2.3%) Ships & 7711 9710 (3.4%) Gold, non-monetary 2731 0544 0577
boats
7831 (1.4%) 7139 (1.3%) (0.85%)
Public Piston engines Edible nuts
transportation parts N.E.S.
vehicles 0575 0571 1211
8462 (2.6%) Knitted 8459 (1.7%) 8451 (1.2%) 8472 8435 6522 6531 8973 (1.6%) 6612 (1.1%) 2879 0572
undergarments of cotton Other knitted (0.69%) Precious jewellery Cement 8939 (1.1%) 5834
outerwear 8452 Miscellaneous
8423 (1.1%) 8441 2871 articles of plastic 6210
0579 0980 8931 4312
8481
6514 6513 5541
8439 (1.7%) Other 6584 (1.4%) 6552 (1%) 8463 6539 0484 6613 6595
women outerwear Linens & 0589 0565
furnishing textile (0.88%) (0.86%)
Building &
Man-made
articles
monumental carpets
* Numbers indicate SITC-4 rev 2 codes. Parenthesis indicate percentage of total exports. Treemap Headers show: Total Trade/Total World Trade (share of world trade represented by the country).