Page 332 - The Atlas of Economic Complexity
P. 332

MAPPING PATHS TO PROSPERITY  |  333


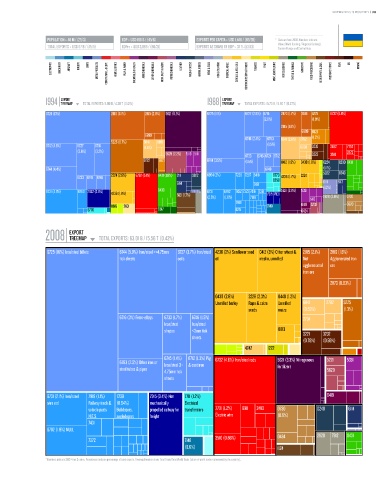
                   POPULATION ≥ 46 M / (25/3)  GDP ≥ USD 180 b / (45/6)   EXPORTS PER CAPITA ≥ USD 1,448 / (69/20)  *   Data are from 2008. Numbers indicate:
                                                                                                          value (World Ranking / Regional Ranking).
                   TOTAL EXPORTS ≥ USD 67 b / (45/8)  GDPpc ≥ USD 3,899 / (80/21)  EXPORTS AS SHARE OF GDP ≥ 37 % (53/13)     Eastern Europe and Central Asia.

                    ELECTRONICS  MACHINERY  AIRCRAFT   bOILERS   SHIPS   METAL PRODUCTS  CONSTR. MATL. & EqPT.  HOME & OFFICE  PULP & PAPER  CHEMICALS & HEALTH  AGROCHEMICALS  OTHER CHEMICALS  INOR. SALTS & ACIDS  PETROCHEMICALS  LEATHER  MILK & CHEESE  ANIMAL FIbERS  MEAT & EGGS  FISH & SEAFOOD  TROPICAL AGRIC.  CEREALS & vEG. OILS  COTTON/RICE/SOY & OTHERS  TObACCO  FRUIT  MISC. AGRICULTURE  NOT CLASSIFIED  TEXTILE & FAbRICS  GARMENTS  FOOD PROCESSING  bEER/SPIRITS & CIGS.  PRECIOUS STONES  COAL  OIL  MINING


                        EXPORT                                                      EXPORT
                  1994 TREEMAP  TOTAL EXPORTS: 5.00 b / 4.30 T (0.12%)        1988 TREEMAP  TOTAL EXPORTS: 15.70 b / 5.90 T (0.27%)
                                         Total Exports: 5.00 B / 4.30 T (0.12%)                      Total Exports: 15.70 B / 5.90 T (0.27%)
                  6725 (13%)              2816 (6.1%)  2815 (2.8%)  5621 (8.1%)  6725 (11%)  6727 (2.9%) 6716  2873 (1.7%)  2816 5225  6732 (6.8%)
                                                                                                   (2.8%)            (1.9%)
                                                                                                          2815 (1.6%)
                                                                                                                 6899 6821
                                                       6899                                                          (1.2%)
                                          5225 (6.7%)  6841  6891                           6746 (2.4%)  6783  6841 (2.8%) 2782
                  6712 (4.6%)  6727  6716              (1.5%)                                       (1.5%)       6998  3232  2482  7752
                              (3.6%)  (3.2%)                                                                                      2472
                                                               5629 (2.2%)  5113 5111       6733  6745 6724 6712     3222   3510
                                                       3222  6821             6744 (3.5%)   (1.5%)        0412 (1.8%)  0430 (1.6%)  0224  0230 8431
                  6744 (4.4%)                                                                       6749                 (1.1%)
                                          2224 (2.8%)  6732 (5.1%)  8431 (1.8%) 2111  5922  6954 (3%)  7239 7267 6418  6770  2224  5922  0240
                              6733 6745 6746                                                           6259  4236 (1.7%)
                                                                   6114                        7491                      0111  6113
                  6731 (4.9%)  6760 7932 (2.6%)  4236 (1.8%)  8439            6731  6782  7432 7372 7416 7361  7915 7931  5621 (2.8%)  5331  (1.2%)
                                                                   5121 (1.7%)
                                                                              (2.6%)  (1.8%)  7188                  5113  2820 (2.6%)  0730
                                                                                         7919                                     0620
                                          0615  2631                                                7148         6419 5232
                                  6770                      6517                         6251                    6424


                           EXPORT
                  2008 TREEMAP        TOTAL EXPORTS: 63.01 b / 15.56 T (0.43%)
                                                                 Total Exports: 67.01 B / 15.56 T (0.43%)
                   6725 (16%) Iron/steel billets  6744 (5.8%) Iron/steel >=4.75mm  6727 (3.7%) Iron/steel 4236 (3%) Sunflower seed 0412 (3%) Other wheat &  2815 (2.1%)  2816 (1.6%)
                                              tick sheets          coils         oil              meslin, unmilled  Not     Agglomerated iron
                                                                                                                  agglomerated  ore
                                                                                                                  iron ore

                                                                                                                            2873 (0.83%)

                                                                                 0430 (2.6%)  2226 (2.3%)  0440 (1.2%)
                                                                                 Unmilled barley  Rape & colza  Unmilled  6841  2782  5225
                                                                                              seeds      maize    (0.59%)        (1.3%)
                                              6716 (3%) Ferro-alloys  6733 (1.7%)  6746 (1.5%)                    2734
                                                              Iron/steel  Iron/steel
                                                              shapes    <3mm tick                        0813     3221   3232
                                                                        sheets
                                                                                                                  (0.78%)  (0.59%)
                                                                                            4242     1222

                                                              6745 (1.4%)  6712 (1.3%) Pig  6732 (4.6%) Iron/steel rods  5621 (3.3%) Nitrogenous  5221  5331
                                              6783 (2.3%) Other iron or  Iron/steel 3 - & cast iron
                                              steel tubes & pipes                                       fertilizers        5629
                                                              4.75mm tick
                                                              sheets


                   6731 (2.1%) Iron/steel  7919 (1.1%)  7239  7915 (3.4%) Not  7711 (1.2%)                                 6419
                   wire rod       Railway track & (0.94%)  mechanically  Electrical
                                  vehicle parts  Bulldozers,  propelled railway for transformers  7731 (1.2%)  6911  2483  0730  0240  6114
                                  N.E.S.    angledozers  freight                 Electric wire          (0.9%)
                                  7431      & levellers
                   6782 (1.9%) NULL         parts N.E.S.

                                  7372                                7148       3510 (0.86%)           0484           2820  7912  8431
                                                                      (0.6%)                            1124

                  * Numbers indicate SITC-4 rev 2 codes. Parenthesis indicate percentage of total exports. Treemap Headers show: Total Trade/Total World Trade (share of world trade represented by the country).
   327   328   329   330   331   332   333   334   335   336   337