
Page 336 - The Atlas of Economic Complexity
P. 336
MAPPING PATHS TO PROSPERITY | 337
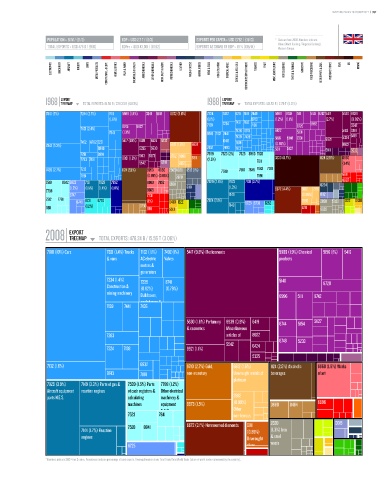
POPULATION ≥ 61 M / (21/3) GDP ≥ USD 2.7 T / (6/3) EXPORTS PER CAPITA ≥ USD 7,752 / (31/13) * Data are from 2008. Numbers indicate:
value (World Ranking / Regional Ranking).
TOTAL EXPORTS ≥ USD 476 b / (9/6) GDPpc ≥ USD 43,361 / (18/12) EXPORTS AS SHARE OF GDP ≥ 18 % (105/14) Western Europe.
ELECTRONICS MACHINERY AIRCRAFT bOILERS SHIPS METAL PRODUCTS CONSTR. MATL. & EqPT. HOME & OFFICE PULP & PAPER CHEMICALS & HEALTH AGROCHEMICALS OTHER CHEMICALS INOR. SALTS & ACIDS PETROCHEMICALS LEATHER MILK & CHEESE ANIMAL FIbERS MEAT & EGGS FISH & SEAFOOD TROPICAL AGRIC. CEREALS & vEG. OILS COTTON/RICE/SOY & OTHERS TObACCO FRUIT MISC. AGRICULTURE NOT CLASSIFIED TEXTILE & FAbRICS GARMENTS FOOD PROCESSING bEER/SPIRITS & CIGS. PRECIOUS STONES COAL OIL MINING
EXPORT EXPORT
1968 TREEMAP TOTAL EXPORTS: 15.58 b / 228.33 b (6.83%) 1988 TREEMAP TOTAL EXPORTS: 145.53 b / 2.79 T (5.21%)
Total Exports: 15.58 B / 228.33 B (6.83%) Total Exports: 145.53 B / 2.79 T (5.21%)
7810 (7%) 7244 (2.7%) 7411 5989 (1.9%) 3345 5148 6672 (5.6%) 7224 7492 6251 7491 7449 5989 8748 5111 5145 8742 5417 5530 8939
(1.6%) (1.1%) 7431 7162 8743 (1.2%) (1.1%) (2.7%) (0.88%)
8745 8822 7139 7234 7138 8720 5982 5542
7821 (2.4%) 7436 8741 8822 5413 0819
7841 (1.3%) 9510 7132 7441 5331
7439 7428 5156 5148 2331 5334 5419
7452 6782 7271 5417 (1.9%) 6419 6424 5232 6418 7169 8921
7842 (5.3%) 6812 (1.6%) 6831 (0.86%) 8922
6940 5335 5530 7452 7493 7413 5311 5137 5911 5232
7281 6991 5413 6573 2782 6998 7599 7523 (2%) 7525 8983 7528
7783 7491 8921 (1.3%) 6811 (2.5%) 7611 3330 (8.7%) 1124 (2.5%) 8960
5542 6210 6851 (1.4%)
7499 (2.7%) 7212 1124 (5.1%) 6953 8960 26658928 6512 (1%) 7788 7518 7648 7643 7781
7851 (0.89%)(0.85%) 2820 7591 6911
7518 8942 6822 7131 7928 7932 6960 7852 6638 7929 (2.6%) 7923 7931 (3.7%) 0224 6997
(1.2%) (1.5%) (1.4%) (1.8%) 6118 (1.3%) 6672 (4.4%) 6812 2782
7788 6665
6747 7731 7149 (0.86%) 0112
7512 7781 8731 6770 7924 (2.1%) 1222 0430
6749 (1%) 0430 1222 6725 6733 6252 2882 2820 5823
8811 (1.2%) 0730 6911 5513 7148 5241 8928
EXPORT
2008 TREEMAP TOTAL EXPORTS: 476.24 b / 15.56 T (3.06%)
Total Exports: 476.24 B / 15.56 T (3.06%)
7810 (10%) Cars 7821 (1.4%) Trucks 7162 (1.1%) 7492 (1%) 5417 (9.8%) Medicaments 5989 (1.9%) Chemical 5156 (1%) 5416
& vans AC electric Valves products
motors &
generators
7234 (1.4%) 7239 8741 5148
Construction & (0.92%) (0.79%) 8720
mining machinery Bulldozers, 8996 5111 8742
angledozers &
7139 7441 7436
levellers parts
N.E.S.
5530 (1.6%) Perfumery 8939 (0.9%) 5419 8744 5154 5827
& cosmetics Miscellaneous
7283 articles of 8922
plastic 8748 5233
5542
7224 7138 8921 (1.1%) 6424
5335
7132 (1.6%) 6832 9710 (2.7%) Gold, 6812 (1.6%) 1124 (2.5%) Alcoholic 8960 (1.9%) Works
8743 7188 non-monetary Unwrought metals of beverages of art
platinum
7929 (3.9%) 7149 (3.3%) Parts of gas & 7599 (1.5%) Parts 7788 (1.2%)
Aircraft equipment reaction engines of cash registers & Other electrical
parts N.E.S. calculating machinery & 2882
machines equipment 8973 (1.5%) (0.99%) 0980 0484 6996
N.E.S. Other
7523 7641 non-ferrous
base metals 2820 0015
7528 8841 6672 (3.1%) Not mounted diamonds 6811
7144 (1.7%) Reaction (0.89%) (1.3%) Iron
engines Unwrought & steel
6725 silver waste
* Numbers indicate SITC-4 rev 2 codes. Parenthesis indicate percentage of total exports. Treemap Headers show: Total Trade/Total World Trade (share of world trade represented by the country).