
Page 60 - The Atlas of Economic Complexity
P. 60
in this part we present five different rankings. these rankings sort countries according to:
ranKing 1: economic ranKing 2: expected ranKing 3: expected gDp ranKing 4: Change in ranKing 5: expected
Complexity index (eCi). growth in per Capita gDp growth to 2020. economic Complexity (1964- Contribution to World gDp
to 2020. 2008). growth to 2020.
each of these five rankings captures a different aspect of the world economy. this is well illustrated by the five countries that make it to the top of each ranking.
according to the aforementioned ranking order, these are: Japan, China, Uganda, Mauritius and the United states. the heterogeneity of this group shows the wide
range of dimensions that are captured by these five different rankings (table 1). next, we comment each one of them briefly, and invite readers to explore them by
themselves.
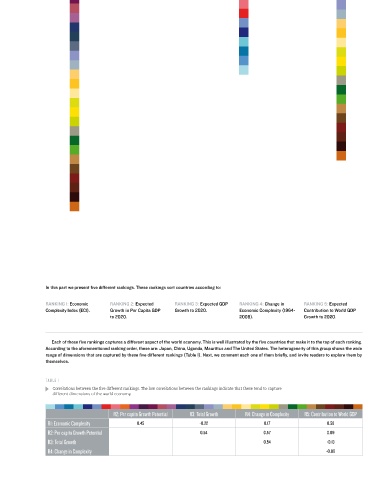
TAbLE 1
Correlations between the five different rankings. The low correlations between the rankings indicate that these tend to capture
different dimensions of the world economy.
R2: Per capita Growth Potential R3: Total Growth R4: Change in Complexity R5: Contribution to World GDP
R1: Economic Complexity 0.45 -0.22 0.17 0.58
R2: Per capita Growth Potential 0.54 0.57 0.09
R3: Total Growth 0.54 -0.13
R4: Change in Complexity -0.09