
Page 58 - The Atlas of Economic Complexity
P. 58
MAPPING PATHS TO PROSPERITY | 59
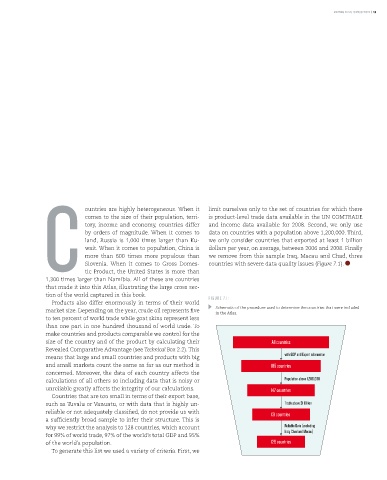
C ountries are highly heterogeneous. When it limit ourselves only to the set of countries for which there
is product-level trade data available in the UN COMTRADE
comes to the size of their population, terri-
and income data available for 2008. Second, we only use
tory, income and economy, countries differ
data on countries with a population above 1,200,000. Third,
by orders of magnitude. When it comes to
land, Russia is 1,000 times larger than Ku-
we only consider countries that exported at least 1 billion
wait. When it comes to population, China is
dollars per year, on average, between 2006 and 2008. Finally
more than 600 times more populous than
Slovenia. When it comes to Gross Domes-
countries with severe data quality issues (Figure 7.1).
tic Product, the United States is more than
1,300 times larger than Namibia. All of these are countries we remove from this sample Iraq, Macau and Chad, three
that made it into this Atlas, illustrating the large cross sec-
tion of the world captured in this book.
FIGURE 7.1:
Products also differ enormously in terms of their world
Schematic of the procedure used to determine the countries that were included
market size. Depending on the year, crude oil represents five in the Atlas.
to ten percent of world trade while goat skins represent less
than one part in one hundred thousand of world trade. To
make countries and products comparable we control for the
size of the country and of the product by calculating their All countries
Revealed Comparative Advantage (see Technical Box 2.2). This
with GDP and Export information
means that large and small countries and products with big
and small markets count the same as far as our method is 185 countries
concerned. Moreover, the data of each country affects the
calculations of all others so including data that is noisy or Population above 1,200,000
unreliable greatly affects the integrity of our calculations. 147 countries
Countries that are too small in terms of their export base,
such as Tuvalu or Vanuatu, or with data that is highly un- Trade above $1 Billion
reliable or not adequately classified, do not provide us with
131 countries
a sufficiently broad sample to infer their structure. This is
why we restrict the analysis to 128 countries, which account Reliable Data (excluding
Iraq, Chad and Macau)
for 99% of world trade, 97% of the world’s total GDP and 95%
of the world’s population. 128 countries
To generate this list we used a variety of criteria. First, we