
Page 80 - The Atlas of Economic Complexity
P. 80
MAPPING PATHS TO PROSPERITY | 81
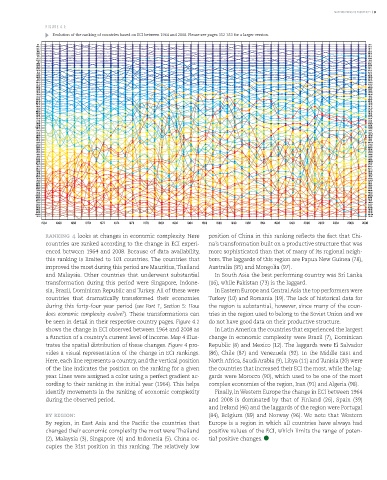
FIGURE 4.1:
Evolution of the ranking of countries based on ECI between 1964 and 2008. Please see pages 352-353 for a larger version.
CHE 1 JPN 1
SWE 2 CHE 2
AUT 3 SWE 3
GBR 4 FIN 4
JPN 5 AUT 5
FRA 6 GBR 6
USA 7 SGP 7
ITA 8 KOR 8
BEL 9 HUN 9
NOR 10 FRA 10
FIN 11 USA 11
DNK 12 ITA 12
NLD 13 DNK 13
HKG 14 IRL 14
HUN 15 ISR 15
POL 16 BEL 16
IRL 17 MEX 17
PAN 18 POL 18
PRT 19 NLD 19
KOR 20 ESP 20
ISR 21 HKG 21
CAN 22 ROU 22
BGR 23 CHN 23
ESP 24 NOR 24
CHN 25 THA 25
ROU 26 MYS 26
SLV 27 PRT 27
SGP 28 PAN 28
JOR 29 CAN 29
CRI 30 BGR 30
NZL 31 LBN 31
AUS 32 TUR 32
URY 33 BRA 33
GRC 34 NZL 34
MEX 35 TUN 35
CHL 36 JOR 36
GTM 37 CRI 37
IND 38 GRC 38
LBN 39 IND 39
MAR 40 COL 40
MRT 41 ZAF 41
ARG 42 ARG 42
CUB 43 URY 43
COL 44 PHL 44
EGY 45 SLV 45
DZA 46 IDN 46
TUN 47 DOM 47
ZAF 48 ALB 48
MNG 49 GTM 49
ZWE 50 TTO 50
ALB 51 EGY 51
PAK 52 CHL 52
VEN 53 VNM 53
JAM 54 AUS 54
HND 55 SAU 55
NIC 56 LKA 56
TTO 57 SYR 57
SEN 58 MUS 58
SYR 59 SEN 59
VNM 60 QAT 60
OMN 61 MAR 61
PER 62 KEN 62
TUR 63 ZWE 63
PHL 64 HND 64
ECU 65 JAM 65
LBR 66 CUB 66
BOL 67 PRY 67
IRN 68 PAK 68
PRY 69 OMN 69
MYS 70 PER 70
BRA 71 UGA 71
THA 72 MDG 72
ZMB 73 NIC 73
MWI 74 KWT 74
CIV 75 ECU 75
GIN 76 TZA 76
MLI 77 ZMB 77
KHM 78 LAO 78
LAO 79 GHA 79
LKA 80 KHM 80
KEN 81 BOL 81
GHA 82 CIV 82
MDG 83 VEN 83
COG 84 ETH 84
DOM 85 IRN 85
ETH 86 MWI 86
SAU 87 MNG 87
IDN 88 LBR 88
CMR 89 MOZ 89
AGO 90 MLI 90
PNG 91 GAB 91
MOZ 92 LBY 92
TZA 93 CMR 93
UGA 94 DZA 94
SDN 95 GIN 95
GAB 96 NGA 96
NGA 97 PNG 97
QAT 98 AGO 98
KWT 99 COG 99
MUS 100 MRT 100
LBY 101 SDN 101
1964 1966 1968 1970 1972 1974 1976 1978 1980 1982 1984 1986 1988 1990 1992 1994 1996 1998 2000 2002 2004 2006 2008
ranking 4 looks at changes in economic complexity. Here position of China in this ranking reflects the fact that Chi-
countries are ranked according to the change in ECI experi- na’s transformation built on a productive structure that was
enced between 1964 and 2008. Because of data availability, more sophisticated than that of many of its regional neigh-
this ranking is limited to 101 countries. The countries that bors. The laggards of this region are Papua New Guinea (78),
improved the most during this period are Mauritius, Thailand Australia (95) and Mongolia (97).
and Malaysia. Other countries that underwent substantial In South Asia the best performing country was Sri Lanka
transformation during this period were Singapore, Indone- (16), while Pakistan (73) is the laggard.
sia, Brazil, Dominican Republic and Turkey. All of these were In Eastern Europe and Central Asia the top performers were
countries that dramatically transformed their economies Turkey (10) and Romania (19). The lack of historical data for
during this forty-four year period (see Part 1, Section 5: How the region is substantial, however, since many of the coun-
does economic complexity evolve?). These transformations can tries in the region used to belong to the Soviet Union and we
be seen in detail in their respective country pages. Figure 4.1 do not have good data on their productive structure.
shows the change in ECI observed between 1964 and 2008 as In Latin America the countries that experienced the largest
a function of a country’s current level of income. Map 4 illus- change in economic complexity were Brazil (7), Dominican
trates the spatial distribution of these changes. Figure 4 pro- Republic (8) and Mexico (12). The laggards were El Salvador
vides a visual representation of the change in ECI rankings. (86), Chile (87) and Venezuela (92). In the Middle East and
Here, each line represents a country, and the vertical position North Africa, Saudi Arabia (9), Libya (11) and Tunisia (20) were
of the line indicates the position on the ranking for a given the countries that increased their ECI the most, while the lag-
year. Lines were assigned a color using a perfect gradient ac- gards were Morocco (90), which used to be one of the most
cording to their ranking in the initial year (1964). This helps complex economies of the region, Iran (91) and Algeria (98).
identify movements in the ranking of economic complexity Finally, in Western Europe the change in ECI between 1964
during the observed period. and 2008 is dominated by that of Finland (26), Spain (39)
and Ireland (46) and the laggards of the region were Portugal
by region: (84), Belgium (89) and Norway (96). We note that Western
By region, in East Asia and the Pacific the countries that Europe is a region in which all countries have always had
changed their economic complexity the most were Thailand positive values of the ECI, which limits the range of poten-
(2), Malaysia (3), Singapore (4) and Indonesia (5). China oc- tial positive changes.
cupies the 31st position in this ranking. The relatively low