
Page 14 - spectroscopic-atlas-5_0-english_Neat
P. 14
Spectroscopic Atlas for Amateur Astronomers 14
3 Selection, Processing and Presentation of the Spectra
3.1 Selection of Spectra
Main criteria for the selection of the spectra have been the documentation of the spectral
characteristics and further the demonstration of certain effects e.g. due to the different lu-
minosity classes. The consideration of bright “common knowledge stars” was of secondary
importance. In principle, every spectral class, including some extraordinary star types, is
presented at least with an “early” and a “late” representative spectrum to show the devel-
opment of characteristic features in the profile. Commented in separate chapters are spec-
tra of emission nebulae, composite spectra of extragalactic objects, reflection spectra of
solar system bodies, absorption bands generated by the earth’s atmosphere and some pro-
files of terrestrial light sources.
3.2 Recording and Resolution of the Spectra
Most of the spectra have been recorded with the DADOS spectrograph [603], equipped
with reflection gratings of 200- or 900 Lines/mm. Unless otherwise noted, the recording
was made through the 8 inch Schmidt-Cassegrain Celestron C8, the 25μm slit of the DA-
DOS spectrograph. To display some highly resolved spectral details, the SQUES Echelle
spectrograph was used [600], applying slit widths of about 15-25μm. The recording was
finally made with the monochrome camera Meade DSI III Pro or the cooled ATIK 314L+,
both equipped with the same Sony chip ICX285AL. The spectra on the Tables 5 (WR133),
70 and 84 have been recorded with Martin Huwiler through the CEDES 36 inch telescope
of the Mirasteilas Observatory in Falera (see Appendix 34.4). Anyway applying longer expo-
sure times, these objects are also within the reach of average amateur equipment!
The processing of the profiles with Vspec yields about following dispersion values [Å/pixel]:
DADOS 200L mm-1: 2.55, DADOS 900L mm-1: 0.65, SQUES Echelle: 0.18.
Data of the Sony Chip ICX285AL: 1.4 Mega-pixel, 2/3" Monochrome CCD, Pixel size
6.45µm x 6.45µm [606]. For longer exposure times a dark frame was subtracted, if neces-
sary also the separately recorded light pollution (with Fitswork). The processing of a "flat
field" was omitted.
According to the Manual of the DADOS Spectrograph
[603] the R-value (resolution), corresponds to ܴଶ = 647
at 6160 Å and ܴଽ = 3,000 at 5610 Å (slit width 25 μm).
My own measurements in this wavelength domain, using
several averaged FWHM values of Neon emission lines,
yielded R-values in the order of ܴଶ = 900, respectively
ܴଽ = 4,000. Generally these resolutions have proven to
be ideal for the presentation of the stellar spectral se-
quence. Therefore it’s not surprising that Gray/Corbally [2]
denote profiles with a resolution of ~ 3 Å as "classification
resolution spectra”. Even the professional astronomy uses
spectrographs with lower resolutions for certain tasks.
Substantially higher R-values would be soon comparable
to reading a newspaper with the microscope.
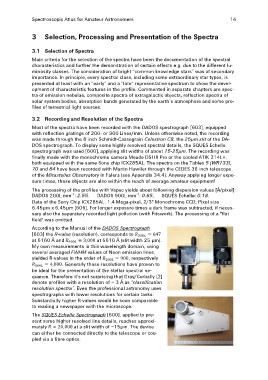
The SQUES Echelle Spectrograph [600], applied to pre-
sent some higher resolved line details, reaches approxi-
mately ܴ ≈ 20,000 at a slit width of ~15μm. The device
can either be connected directly to the telescope or cou-
pled via a fibre optics.