
Page 15 - spectroscopic-atlas-5_0-english_Neat
P. 15
Spectroscopic Atlas for Amateur Astronomers 15
3.3 The Processing of the Spectra
The monochrome fits images have been processed with the standard procedure of IRIS
[550]. In most cases, about 5–7 spectral profiles have been stacked, to achieve noise re-
duction. The generating and analysing of the final profile was performed with Vspec [551].
The procedure is described in detail in the IRIS and Vspec manuals. For the software func-
tions, applied to process the spectra in this atlas, a step by step description is available in
[31] (German only).
With minor exceptions in all broadband spectra (200L) the pseudo-continuum was re-
moved. The profiles have been rectified – divided by the course of their own continuum.
Thus, the intensity of the spectral lines becomes visually comparable over the entire range
and further it results a flat (rectified), space-saving and easily readable profile [30]. The
relative depth or height of a line in relation to the height of the according continuum level is
crucial for the intensity comparison. The profile of a pseudo-continuum presents strong
lines at the blue or red end of the spectrum optically as relatively too weak and vice versa,
weak lines in the middle part, -as too high. But just this reasonable correction may confuse
the beginners, if they try to find lines of their uncorrected pseudo-continuum in the flat, rec-
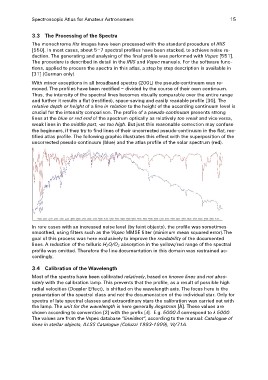
tified atlas profile. The following graphic illustrates this effect with the superposition of the
uncorrected pseudo-continuum (blue) and the atlas profile of the solar spectrum (red).
In rare cases with an increased noise level (by faint objects), the profile was sometimes
smoothed, using filters such as the Vspec MMSE filter (minimum mean squared error).The
goal of this process was here exclusively to improve the readability of the documented
lines. A reduction of the telluric H2O/O2 absorption in the yellow/red range of the spectral
profile was omitted. Therefore the line documentation in this domain was restrained ac-
cordingly.
3.4 Calibration of the Wavelength
Most of the spectra have been calibrated relatively, based on known lines and not abso-
lutely with the calibration lamp. This prevents that the profile, as a result of possible high
radial velocities (Doppler Effect), is shifted on the wavelength axis. The focus here is the
presentation of the spectral class and not the documentation of the individual star. Only for
spectra of late spectral classes and extraordinary stars the calibration was carried out with
the lamp. The unit for the wavelength is here generally Angstrom [Å]. These values are
shown according to convention [2] with the prefix [λ]. E.g. 5000 Å correspond to λ 5000.
The values are from the Vspec database "lineident", according to the manual: Catalogue of
lines in stellar objects, ILLSS Catalogue (Coluzzi 1993-1999), VI/71A.