
Page 169 - spectroscopic-atlas-5_0-english_Neat
P. 169
Spectroscopic Atlas for Amateur Astronomers 169
point. Thus Uranus and Neptune are also called "ice planets". Their reflectance spectra are
strikingly similar. At Uranus however, the absorptions are much more intense.
Compared with the gas planets Jupiter and Saturn, these effects generate here different
reflectance spectra with much more intense absorptions, which additionally appear even in
the short-wave region [380]. These absorptions are generally responsible for the bluish
colour of the outer two ice planets.
Titan, with a diameter of 5,150 km, is after Ganymede the second largest planet in the so-
lar system, but the only one who has a dense atmosphere, chiefly consisting of nitrogen.
Anyway the surface and outer mantle of the moon consist of ice and methane hydrate.
Similar to the Earth, Titan has a liquid cycle, but working here with methane instead of wa-
ter. Similar to Jupiter and Saturn the corresponding absorptions are limited here on the
long-wavelength (red) section of the spectrum.
In the reflectance spectra of Table 92, the absorptions of the solar spectrum are hardly rec-
ognisable.
29.6 Comet C/2009 P1 Garradd
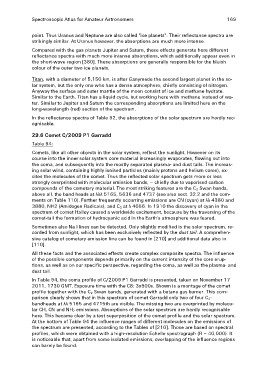
Table 94:
Comets, like all other objects in the solar system, reflect the sunlight. However on its
course into the inner solar system core material increasingly evaporates, flowing out into
the coma, and subsequently into the mostly separated plasma- and dust tails. The increas-
ing solar wind, containing highly ionised particles (mainly protons and helium cores), ex-
cites the molecules of the comet. Thus the reflected solar spectrum gets more or less
strongly overprinted with molecular emission bands, – chiefly due to vaporised carbon
compounds of the cometary material. The most striking features are the C2 Swan bands,
above all, the band heads at λλλ 5165, 5636 and 4737 (see also sect. 32.2 and the com-
ments on Table 110). Further frequently occurring emissions are CN (cyan) at λλ 4380 and
3880, NH2 (Amidogen Radicals), and C3 at λ 4056. In 1910 the discovery of cyan in the
spectrum of comet Halley caused a worldwide excitement, because by the traversing of the
comet-tail the formation of hydrocyanic acid in the Earth's atmosphere was feared.
Sometimes also Na I lines can be detected. Only slightly modified is the solar spectrum, re-
corded from sunlight, which has been exclusively reflected by the dust tail. A comprehen-
sive catalog of cometary emission line can be found in [210] and additional data also in
[110].
All these facts and the associated effects create complex composite spectra. The influence
of the possible components depends primarily on the current intensity of the core erup-
tions, as well as on our specific perspective, regarding the coma, as well as the plasma- and
dust tail.
In Table 94, the coma profile of C/2009 P1 Garradd is presented, taken on November 17
2011, 1730 GMT. Exposure time with the C8: 3x900s. Shown is a montage of the comet
profile together with the C2 Swan bands, generated with a butane gas burner. This com-
parison clearly shows that in this spectrum of comet Garradd only two of four C2-
bandheads at λλ 5165 and 4715th are visible. The missing two are overprinted by molecu-
lar CH, CN and NH2 emissions. Absorptions of the solar spectrum are hardly recognisable
here. This became clear by a test superposition of the comet profile and the solar spectrum.
At the bottom of Table 94 the influence ranges of different molecules on the emissions of
the spectrum are presented, according to the Tables of [210]. Those are based on spectral
profiles, which were obtained with a high-resolution Echelle spectrograph (R ~ 40,000). It
is noticeable that, apart from some isolated emissions, overlapping of the influence regions
can barely be found.