
Page 174 - spectroscopic-atlas-5_0-english_Neat
P. 174
Spectroscopic Atlas for Amateur Astronomers 174
30 Telluric Molecular Absorption
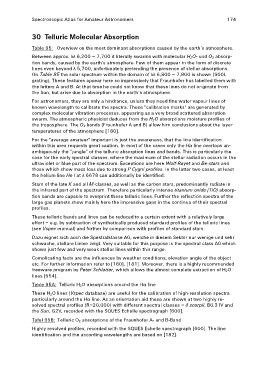
Table 95: Overview on the most dominant absorptions caused by the earth’s atmosphere.
Between approx. λλ 6,200 – 7,700 it literally swarms with molecular H2O- und O2 absorp-
tion bands, caused by the earth’s atmosphere. Few of them appear in the form of discrete
lines even beyond λ 5,700, unfortunately pretending the presence of stellar absorptions.
On Table 95 the solar spectrum within the domain of λλ 6,800 – 7,800 is shown (900L
grating). These features appear here so impressively that Fraunhofer has labelled them with
the letters A and B. At that time he could not know that these lines do not originate from
the Sun, but arise due to absorption in the earth’s atmosphere.
For astronomers, they are only a hindrance, unless they need fine water vapour lines of
known wavelength to calibrate the spectra. These "calibration marks" are generated by
complex molecular vibration processes, appearing as a very broad scattered absorption
swarm. The atmospheric physicist deduces from the H2O absorptions moisture profiles of
the troposphere. The O2 bands (Fraunhofer A and B) allow him conclusions about the layer
temperatures of the atmosphere [180].
For the "average amateur" important is just the awareness, that the line identification
within this area requests great caution. In most of the cases only the Hα line overtops un-
ambiguously the “jungle” of the telluric absorption lines and bands. This is particularly the
case for the early spectral classes, where the maximum of the stellar radiation occurs in the
ultraviolet or blue part of the spectrum. Exceptions are here Wolf-Rayet and Be-stars and
those which show mass loss due to strong P Cygni profiles. In the latter two cases, at least
the helium line He l at λ 6678 can additionally be identified.
Stars of the late K and all M-classes, as well as the carbon stars, predominantly radiate in
the infrared part of the spectrum. Therefore particularly intense titanium oxide (TiO) absorp-
tion bands are capable to overprint these telluric lines. Further the reflection spectra of the
large gas planets show mainly here the impressive gaps in the continua of their spectral
profiles.
These telluric bands and lines can be reduced to a certain extent with a relatively large
effort – e.g. by subtraction of synthetically produced standard profiles of the telluric lines
(see Vspec manual) and further by comparison with profiles of standard stars.
Dazu eignet sich auch die Spektralklasse A0, welche in diesem Sektor nur wenige und sehr
schwache, stellare Linien zeigt. Very suitable for this purpose is the spectral class A0 which
shows just few and very weak stellar lines within this range.
Complicating facts are the influences by weather conditions, elevation angle of the object
etc. For further information refer to [180], [181]. Moreover, there is a highly recommended
freeware program by Peter Schlatter, which allows the almost complete extraction of H2O
lines [554].
Table 95A: Telluric H2O absorptions around the Hα line
These H2O lines (Vspec database) are useful for the calibration of high-resolution spectra
particularly around the Hα line. As an orientation aid these are shown at two highly re-
solved spectral profiles (R~20,000) with different spectral classes – δ scorpii, B0.3 IV and
the Sun, G2V, recorded with the SQUES Echelle spectrograph [600].
Tafel 95B: Telluric O2 absorptions of the Fraunhofer A- and B-Band
Highly resolved profiles, recorded with the SQUES Echelle spectrograph [600]. The line
identification and the according wavelengths are based on [182].