
Page 178 - spectroscopic-atlas-5_0-english_Neat
P. 178
Spectroscopic Atlas for Amateur Astronomers 178
31 The Night Sky Spectrum
31.1 Introduction
Mainly due to light pollution and airglow the night sky is significantly brightened and the
astronomical observations thereby seriously hampered.
The light pollution is mainly caused by street lamps and other terrestrial light sources. The
light is chiefly scattered by molecules and particles in the Mesopause (altitude approx. 80 –
100km).
The airglow is produced during the day in the atmosphere by photoionisation of oxygen as a
result of solar UV radiation and chemical reaction chains. At night recombination takes
place, causing emission lines at discrete frequencies. Really striking here are only two of
the O I lines at λλ 5577.35 and 6300.23. The latter is visible just under a very good night
sky, and therefore lacking in the spectrum of Table 96. Airglow however includes also the
rotational and vibrational bands of OH molecules in the near infrared range, detected in
1950 by A. B. Meinel. Further influence, particularly over the continuum of the night sky
spectrum, has the diffuse galactic light (DGL), the integrated starlight (ISL) and the re-
flected zodiacal light (ZL). The latter may also contribute elements of the solar spectrum.
(www.caltech.edu)
31.2 Effects on the Spectrum
Depending on the quality of the night sky, at long to very long exposure times the emissions
of airglow and light pollution can disturbingly superimpose the recorded signal of the exam-
ined object, example see M1, Table 86 and 96. The effects of airglow to the spectrum are
much less harmful than the light pollution, which can consist of dozens of emission lines,
depending on the type of terrestrial light sources in the wider surroundings, as well as me-
teorological factors. Under a perfect night sky, only the airglow is visible in the spectrum.
31.3 Countermeasures
For long term exposures of two-dimensional appearing objects like nebulae, helps the re-
cording of the night sky spectrum in the immediate vicinity of the examined object (with the
same exposure time). This must then be subtracted from the object spectrum, eg with Fits-
work. For point-like appearing objects, the light pollution can be subtracted together with
the sky background (eg IRIS).
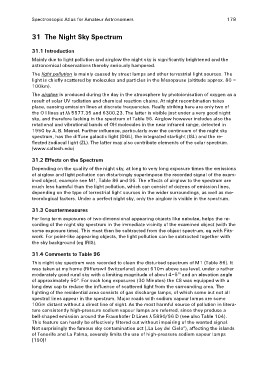
31.4 Comments to Table 96
This night sky spectrum was recorded to clean the disturbed spectrum of M1 (Table 86). It
was taken at my home (Rifferswil Switzerland) about 610m above sea level, under a rather
moderately good rural sky with a limiting magnitude of about 4–5m and an elevation angle
of approximately 50°. For such long exposures (30 Minutes) the C8 was equipped with a
long dew cap to reduce the influence of scattered light from the surrounding area. The
lighting of the residential area consists of gas discharge lamps, of which some but not all
spectral lines appear in the spectrum. Major roads with sodium vapour lamps are some
100m distant without a direct line of sight. As the most harmful source of pollution in litera-
ture consistently high-pressure sodium vapour lamps are referred, since they produce a
bell-shaped emission around the Fraunhofer D Lines λ 5890/96 D (see also Table 104).
This feature can hardly be effectively filtered out without impairing of the wanted signal.
Not surprisingly the famous sky contamination act („La Ley del Cielo“), affecting the islands
of Tenerife and La Palma, severely limits the use of high-pressure sodium vapour lamps
[190]!