
Page 72 - spectroscopic-atlas-5_0-english_Neat
P. 72
Spectroscopic Atlas for Amateur Astronomers 72
16 Spectral Class F
16.1 Overview
The F-class is located directly above the G-category, where our Sun is classified. It includes
several well-known, bright yellow shining stars like Procyon, Caph (β Cas), Porrima
(γ Vir), Mirfak (α Per), Canopus in the southern sky and even the Pole Star. On the Giant
Branch of the HRD we find here several pulsation variables, belonging to the categories of
δ Cephei and RR Lyrae.
16.2 Parameters of the Early to Late F-Class Stars
The following table shows the data exclusively for the Main Sequence Stars of the F-class,
compared to the Sun ( ) and according to [701].
Mass Stay on main Temperature Radius Luminosity
M/M sequence [y] L/L
photosphere [K] R/R
1.6 – 1.1 3bn – 7bn 7,200 – 6,000 1.6 – 1.2 6.5 – 2.0
16.3 Spectral Characteristics of the F-Class
The H-Balmer lines are now much weaker and the Fraunhofer H + K lines (Ca II) become the
dominant features, so that the Fraunhofer H absorption now clearly displaces the Hε line.
Towards the late subclasses the neutral elements, e.g. Fe l, Cr l, replace now increasingly
the absorption of the ionised ones. The Ca I line at λ 4227 clearly intensifies, as well as the
G-band (CH molecular) which surpasses within the F-Class the intensity of the neighbouring
Hγ line. This striking “line double” can therefore exclusively be seen here so it forms essen-
tially the unmistakable "Brand" of the F-class! The Magnesium Triplet (λλ 5168–83) be-
comes here stronger, compared to the A- Class.
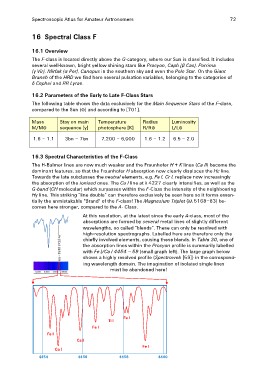
At this resolution, at the latest since the early A-class, most of the
absorptions are formed by several metal lines of slightly different
wavelengths, so called ”blends”. These can only be resolved with
high-resolution spectrographs. Labelled here are therefore only the
chiefly involved elements, causing these blends. In Table 30, one of
the absorption lines within the Procyon profile is summarily labelled
with Fe l/Ca l 4454 – 59 (small graph left). The large graph below
shows a highly resolved profile (Spectroweb [59]) in the correspond-
ing wavelength domain. The imagination of isolated single lines
must be abandoned here!
Fe I Fe I
Ti I
Fe I
Ca I
Ca I Fe I
4454 4456 4458 4460