
Page 140 - Jolliffe I. Principal Component Analysis
P. 140
5.6. Displaying Intrinsically High-Dimensional Data
109
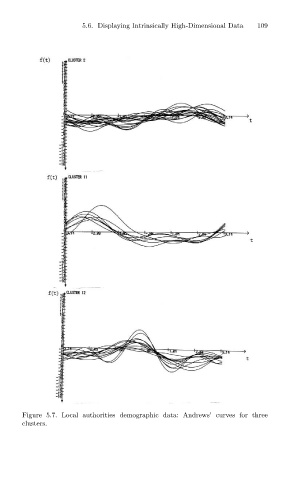
Figure 5.7. Local authorities demographic data: Andrews’ curves for three
clusters.