
Page 267 - Jolliffe I. Principal Component Analysis
P. 267
10. Outlier Detection, Influential Observations and Robust Estimation
234
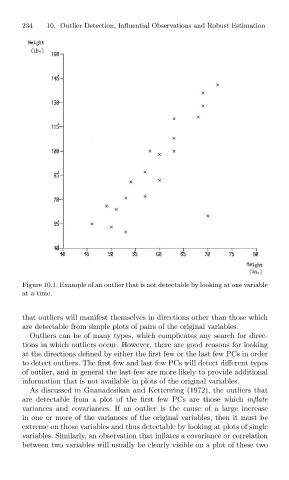
Figure 10.1. Example of an outlier that is not detectable by looking at one variable
at a time.
that outliers will manifest themselves in directions other than those which
are detectable from simple plots of pairs of the original variables.
Outliers can be of many types, which complicates any search for direc-
tions in which outliers occur. However, there are good reasons for looking
at the directions defined by either the first few or the last few PCs in order
to detect outliers. The first few and last few PCs will detect different types
of outlier, and in general the last few are more likely to provide additional
information that is not available in plots of the original variables.
As discussed in Gnanadesikan and Kettenring (1972), the outliers that
are detectable from a plot of the first few PCs are those which inflate
variances and covariances. If an outlier is the cause of a large increase
in one or more of the variances of the original variables, then it must be
extreme on those variables and thus detectable by looking at plots of single
variables. Similarly, an observation that inflates a covariance or correlation
between two variables will usually be clearly visible on a plot of these two