
Page 54 - Jolliffe I. Principal Component Analysis
P. 54
2.3. Principal Components Using a Correlation Matrix
80 44 23
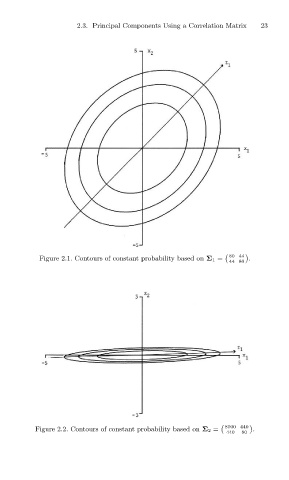
Figure 2.1. Contours of constant probability based on Σ 1 = .
44 80
8000 440
Figure 2.2. Contours of constant probability based on Σ 2 = .
440 80