
Page 54 - More Higher algebra
P. 54
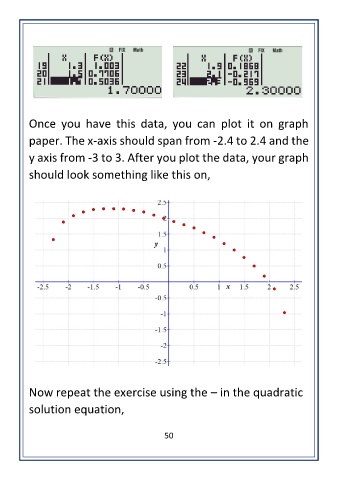
Once  you  have  this  data,  you  can  plot  it  on  graph

        paper. The x-axis should span from -2.4 to 2.4 and the

        y axis from -3 to 3. After you plot the data, your graph
        should look something like this on,


        Now repeat the exercise using the – in the quadratic

        solution equation,


                                          50