
Page 56 - More Higher algebra
P. 56
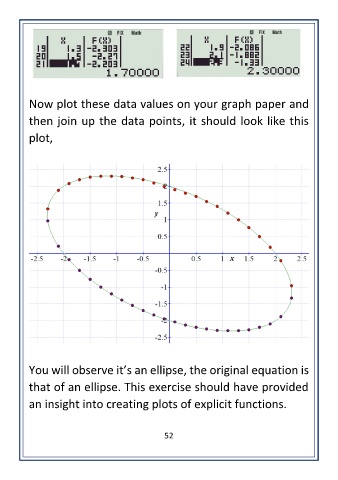
Now plot these data values on your graph paper and

        then join up the data points, it should look like this
        plot,


        You will observe it’s an ellipse, the original equation is

        that of an ellipse. This exercise should have provided

        an insight into creating plots of explicit functions.


                                          52