
Page 14 - Approved Annual Budget FY 2019-2020_Flat
P. 14
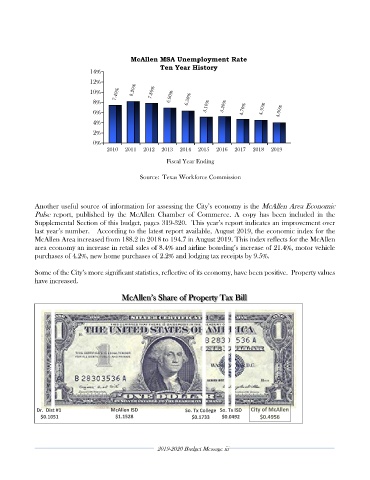
McAllen MSA Unemployment Rate
                                                      Ten Year History
                               14%
                               12%
                               10%     7.40%  8.20%  7.80%
                                8%                       6.90%  6.30%  5.10%  5.20%
                                6%                                               4.70%  4.50%  4.00%
                                4%

                                2%
                                0%
                                    2010  2011  2012  2013  2014   2015  2016  2017  2018  2019
                                                        Fiscal Year Ending


                                               Source:  Texas Workforce Commission


             Another useful source of information for assessing the City’s economy is the McAllen Area Economic
             Pulse  report, published  by the McAllen Chamber of Commerce.  A  copy has been included in  the
             Supplemental Section of this budget, pages 319-320.  This year’s report indicates an improvement over
             last year’s number.   According to the latest report available, August 2019, the economic index for the
             McAllen Area increased from 188.2 in 2018 to 194.7 in August 2019. This index reflects for the McAllen
             area economy an increase in retail sales of 8.4% and airline boarding’s increase of 21.4%, motor vehicle
             purchases of 4.2%, new home purchases of 2.2% and lodging tax receipts by 9.5%.

             Some of the City’s more significant statistics, reflective of its economy, have been positive.  Property values
             have increased.

                                         McAllen’s Share of Property Tax Bill


             Dr.  Dist #1             McAllen ISD             So. Tx College So. Tx ISD  City of McAllen
              $0.1051                  $1.1528                  $0.1733   $0.0492      $0.4956


                                                     2019-2020 Budget Message iii