
Page 19 - Approved Annual Budget FY 2019-2020_Flat
P. 19
EXECUTIVE SUMMARY
The following discussion is a fund-by-fund narrative review of the principal resources estimated to be provided in
this year’s budget, the major budgeted uses of those resources and the resulting fund balance or working capital.
This information is then compared to that of last year’s adjusted budget. The more significant changes are
discussed, including the factors influencing those changes. This discussion should be read in conjunction with the
Budget Message, preceding it, as well as the financial presentations, which follow.
BUDGET AS A WHOLE
The City of McAllen’s budget for FY 2019-2020, including all funds—Governmental (General, Special Revenue,
Debt Service and Capital Projects Funds) and Proprietary (Enterprise and Internal Service Funds), anticipates
raising $432.2M in revenues and transfers in while spending $223.7M for operations, $173.5M for capital
expenditures and $24.9M for debt service, leaving an estimated combined fund balance and working capital of
$191.2M.
GENERAL FUND
The General Fund is used to account for resources traditionally associated with government, which are not required to be
accounted for in another fund.
Revenues and Transfers-In
General Fund revenues and transfers-in are expected to generate $127.5M, an increase of $2.67M 2% more than
last year’s amended budget. The increase is primarily attributable to an increase in Sales and Use tax – 4.6M and
an increase in property tax - $1.85M; which was somewhat offset by a decrease in Franchise Taxes - $379K and
Licenses and Permits - $25K. In addition, the previous amended budget includes a one-time transaction for the
receivable of an equipment lease agreement of $3.8M.
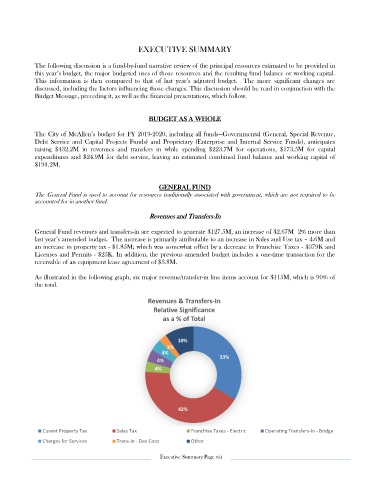
As illustrated in the following graph, six major revenue/transfer-in line items account for $115M, which is 90% of
the total.
Revenues & Transfers-In
Relative Significance
as a % of Total
10%
3%
4%
4% 33%
4%
42%
Curent Property Tax Sales Tax Franchise Taxes - Electric Operating Transfers-In - Bridge
Charges for Services Trans-in - Dev Corp Other
Executive Summary Page viii