
Page 290 - Approved Annual Budget FY 2019-2020_Flat
P. 290
Convention Center Fund
Administration
www.mcallenconventioncenter.net
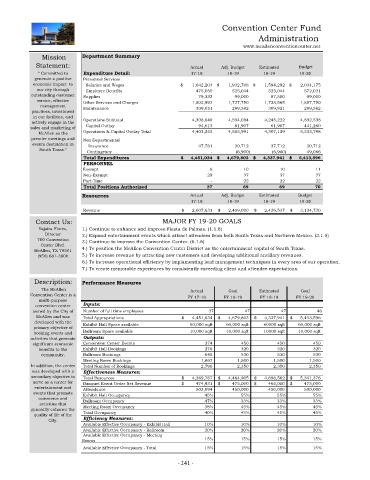
Mission Department Summary
Statement: Actual Adj. Budget Estimated Budget
“ Committed to Expenditure Detail: 17-18 18-19 18-19 19-20
generate a positive Personnel Services
economic impact to Salaries and Wages $ 1,642,203 $ 1,932,708 $ 1,594,292 $ 2,034,175
our city through Employee Benefits 475,060 525,044 525,044 572,031
outstanding customer Supplies 79,333 99,000 87,500 99,000
service, effective Other Services and Charges 1,802,993 1,737,750 1,728,565 1,887,750
management Maintenance 309,051 299,582 309,821 299,582
practices, investment
in our facilities, and
actively engage in the Operations Subtotal 4,308,640 4,594,084 4,245,222 4,892,538
sales and marketing of Capital Outlay 94,613 61,907 61,907 441,260
McAllen as the Operations & Capital Outlay Total 4,403,253 4,655,991 4,307,129 5,333,798
premier meetings and Non Departmental
events destination in Insurance 47,781 30,712 37,712 30,712
South Texas."
Contingency - (6,900) (6,900) 49,086
Total Expenditures $ 4,451,034 $ 4,679,803 $ 4,337,941 $ 5,413,596
PERSONNEL
Exempt 8 10 10 11
Non-Exempt 29 37 37 37
Part-Time - 22 22 22
Total Positions Authorized 37 69 69 70
Resources Actual Adj. Budget Estimated Budget
17-18 18-19 18-19 19-20
Revenue $ 2,607,631 $ 2,409,000 $ 2,436,537 $ 3,134,730
Contact Us: MAJOR FY 19-20 GOALS
Yajaira Flores, 1.) Continue to enhance and improve Fiesta de Palmas. (1.1.8)
Director 2.) Expand entertainment events which attract attendees from both South Texas and Northern Mexico. (2.1.5)
700 Convention 3.) Continue to improve the Convention Center. (6.1.6)
Center Blvd.
McAllen, TX 78501 4.) To position the McAllen Convention Center District as the entertainment capital of South Texas.
(956) 681-3800 5.) To increase revenue by attracting new customers and developing additional ancillary revenues.
6.) To increase operational efficiency by implamenting lead management techniques in every area of our operation.
7.) To create memorable experiences by consistently exceeding client and attendee expectations.
Description: Performance Measures
The McAllen Actual Goal Estimated Goal
Convention Center is a FY 17-18 FY 18-19 FY 18-19 FY 19-20
multi-purpose
convention center Inputs:
owned by the City of Number of full time employees 37 47 47 48
McAllen and was Total Appropriations $ 4,451,034 $ 4,679,803 $ 4,337,941 $ 5,413,596
developed with the Exhibit Hall Space available 60,000 sqft 60,000 sqft 60000 sqft 60,000 sqft
primary objective of
booking events and Ballroom Space available 10,000 sqft 10,000 sqft 10000 sqft 10,000 sqft
activities that generate Outputs:
significant economic Convention Center Events 374 450 450 450
benefits to the Exhibit Hall Bookings 278 320 320 320
community. Ballroom Bookings 645 530 530 530
Meeting Room Bookings 1,867 1,500 1,500 1,500
In addition, the center Total Number of Bookings 2,790 2,350 2,350 2,350
was developed with a Effectiveness Measures:
secondary objective to Total Resources $ 4,369,767 $ 4,464,905 $ 4,696,562 $ 5,341,376
serve as a center for Banquet Event Order Net Revenue $ 474,931 $ 475,000 $ 465,000 $ 475,000
entertainment and Attendance 503,094 450,000 450,000 500,000
events that promote Exhibit Hall Occupancy 45% 55% 55% 55%
commerce and Ballroom Occupancy 47% 33% 33% 33%
activities that
generally enhance the Meeting Room Occupancy 38% 45% 45% 45%
quality of life of the Total Occupancy 40% 45% 45% 45%
City. Efficiency Measures:
Available Effective Occupancy - Exhibit Hall 10% 10% 10% 10%
Available Effective Occupancy - Ballroom 20% 20% 20% 20%
Available Effective Occupancy - Meeting
Rooms 15% 15% 15% 15%
Available Effective Occupancy - Total 15% 15% 15% 15%
- 241 -