
Page 296 - Approved Annual Budget FY 2019-2020_Flat
P. 296
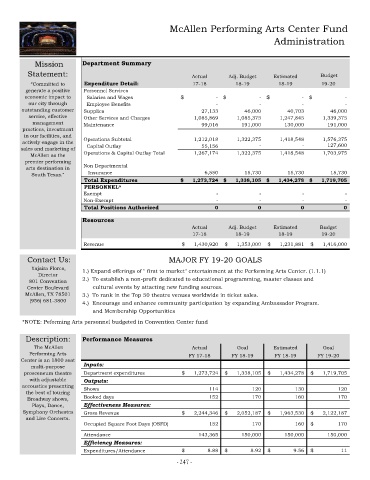
McAllen Performing Arts Center Fund

                                                                                         Administration


          Mission         Department Summary
        Statement:                                            Actual      Adj. Budget    Estimated       Budget
         “Committed to    Expenditure Detail:                 17-18          18-19         18-19         19-20
       generate a positive   Personnel Services
       economic impact to    Salaries and Wages           $           -    $        -    $        -    $         -
        our city through     Employee Benefits                        -             -             -              -
      outstanding customer   Supplies                              27,133        46,000        40,703        46,000
        service, effective   Other Services and Charges         1,085,869      1,085,375     1,247,845     1,339,375
         management       Maintenance                              99,016       191,000       130,000       191,000
      practices, investment
       in our facilities, and
      actively engage in the   Operations Subtotal              1,212,018      1,322,375 -       1,418,548 -       1,576,375
                                                                                                           127,600

      sales and marketing of     Capital Outlay                    55,156
         McAllen as the   Operations & Capital Outlay Total     1,267,174      1,322,375     1,418,548     1,703,975
       premier performing
       arts destination in   Non Departmental
         South Texas."      Insurance                               6,550        15,730        15,730        15,730
                          Total Expenditures              $       1,273,724  $       1,338,105  $       1,434,278  $       1,719,705
                          PERSONNEL*
                          Exempt                                      -             -              -             -
                          Non-Exempt                                  -             -              -             -
                          Total Positions Authorized                  0             0             0             0

                          Resources
                                                              Actual      Adj. Budget    Estimated      Budget
                                                              17-18          18-19         18-19         19-20
                          Revenue                          $      1,430,920  $      1,353,000  $      1,231,881  $      1,416,000

        Contact Us:                                   MAJOR FY 19-20 GOALS
          Yajaira Flores,    1.) Expand offerings of " first to market" entertainment at the Performing Arts Center. (1.1.1)
           Director
        801 Convention    2.)  To establish a non-profit dedicated to educational programming, master classes and
        Center Boulevard        cultural events by attacting new funding sources.
       McAllen, TX 78501  3.)  To rank in the Top 50 theatre venues worldwide in ticket sales.
        (956) 681-3800    4.)  Encourage and enhance community participation by expanding Ambassador Program.
                              and Membership Opportunities
      *NOTE: Peforming Arts personnel budgeted in Convention Center fund

       Description:       Performance Measures

          The McAllen                                         Actual         Goal        Estimated       Goal
        Performing Arts                                      FY 17-18      FY 18-19      FY 18-19       FY 19-20
      Center is an 1800 seat
         multi-purpose    Inputs:
       prosceneum theatre   Department expenditures        $      1,273,724  $      1,338,105  $      1,434,278  $      1,719,705
        with adjustable   Outputs:
      accoustics presenting   Shows                                  114            120           130           120
       the best of touring
        Broadway shows,   Booked days                                152            170           160           170
         Plays, Dance,    Effectiveness Measures:
      Symphony Orchestra   Gross Revenue                   $      2,244,346  $      2,052,187  $      1,963,530  $      2,122,187
       and Live Concerts.
                           Occupied Square Foot Days (OSFD)           152            170           160  $        170

                           Attendance                              143,365       150,000       150,000       150,000
                          Efficiency Measures:
                          Expenditures/Attendance          $          8.88  $       8.92  $       9.56  $         11
                                                         - 247 -