
Page 369 - Approved Annual Budget FY 2019-2020_Flat
P. 369
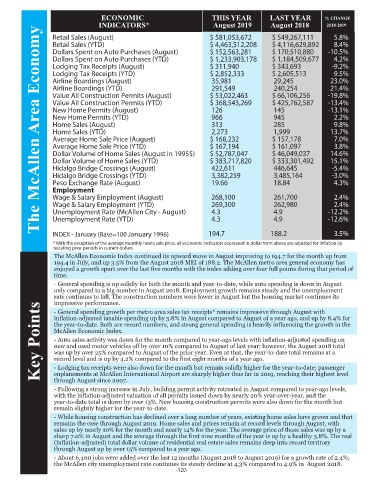
ECONOMIC                            THIS YEAR          LAST YEAR         % CHANGE
                                  INDICATORS*                           August 2019        August 2018       2018-2019
              The McAllen Area Economy
                  Retail Sales (August)                                $ 581,053,672        $ 549,267,111       5.8%
                  Retail Sales (YTD)                                   $ 4,463,512,208      $ 4,116,629,892     8.4%
                  Dollars Spent on Auto Purchases (August)             $ 152,563,281        $ 170,510,880     -10.5%
                  Dollars Spent on Auto Purchases (YTD)                $ 1,233,903,178      $ 1,184,509,677     4.2%
                  Lodging Tax Receipts (August)                        $ 311,940            $ 343,693          -9.2%
                  Lodging Tax Receipts (YTD)                           $ 2,852,333          $ 2,605,513         9.5%
                  Airline Boardings (August)                            35,981               29,245           23.0%
                  Airline Boardings (YTD)                               291,549              240,254          21.4%
                  Value All Construction Permits (August)              $ 53,022,463         $ 66,106,256      -19.8%
                  Value All Construction Permits (YTD)                 $ 368,543,269        $ 425,762,587     -13.4%
                  New Home Permits (August)                             126                  145              -13.1%
                  New Home Permits (YTD)                                966                  945                2.2%
                  Home Sales (August)                                   313                  285                9.8%
                  Home Sales (YTD)                                      2,273                1,999            13.7%
                  Average Home Sale Price (August)                     $ 168,232            $ 157,178           7.0%
                  Average Home Sale Price (YTD)                        $ 167,194            $ 161,097           3.8%
                  Dollar Volume of Home Sales (August in 1995$)        $ 52,787,047         $ 46,049,037      14.6%
                  Dollar Volume of Home Sales (YTD)                    $ 383,717,820        $ 333,301,492     15.1%
                  Hidalgo Bridge Crossings (August)                     422,611              446,645           -5.4%
                  Hidalgo Bridge Crossings (YTD)                        3,382,259            3,485,164         -3.0%
                  Peso Exchange Rate (August)                           19.66                18.84              4.3%
                  Employment
                  Wage & Salary Employment (August)                     268,100              261,700            2.4%

                  Wage & Salary Employment (YTD)                        269,300              262,980            2.4%
                  Unemployment Rate (McAllen City - August)             4.3                  4.9              -12.2%
                  Unemployment Rate (YTD)                               4.3                  4.9              -12.6%


                  INDEX - January (Base=100 January 1996)             194.7                188.2                3.5%
                   * With the exception of the average monthly home sale price, all economic indicators expressed in dollar form above are adjusted for in ation by
                   restating prior periods in current dollars
                   The McAllen Economic Index continued its upward move in August improving to 194.7 for the month up from
                   194.4 in July, and up 3.5% from the August 2018 MEI of 188.2. The McAllen metro area general economy has
                   enjoyed a growth spurt over the last five months with the index adding over four full points during that period of
                   time.
                   - General spending is up solidly for both the month and year-to-date, while auto spending is down in August
                   only compared to a big number in August 2018. Employment growth remains steady and the unemployment
                   rate continues to fall. The construction numbers were lower in August but the housing market continues its
                   impressive performance.
              Key Points  the year-to-date. Both are record numbers, and strong general spending is heavily influencing the growth in the
                   - General spending growth per metro area sales tax receipts* remains impressive through August with
                   inflation-adjusted taxable spending up by 5.8% in August compared to August of a year ago, and up by 8.4% for

                   McAllen Economic Index.
                   - Auto sales activity was down for the month compared to year-ago levels with inflation-adjusted spending on
                   new and used motor vehicles off by over 10% compared to August of last year; however, the August 2018 total
                   was up by over 25% compared to August of the prior year. Even at that, the year-to-date total remains at a
                   record level and is up by 4.2% compared to the first eight months of a year ago.
                   - Lodging tax receipts were also down for the month but remain solidly higher for the year-to-date; passenger
                   enplanements at McAllen International Airport are sharply higher thus far in 2019, reaching their highest level
                   through August since 2007.
                   - Following a strong increase in July, building permit activity retreated in August compared to year-ago levels,
                   with the inflation-adjusted valuation of all permits issued down by nearly 20% year-over-year, and the
                   year-to-date total is down by over 13%. New housing construction permits were also down for the month but
                   remain slightly higher for the year-to-date.
                   - While housing construction has declined over a long number of years, existing home sales have grown and that
                   remains the case through August 2019. Home sales and prices remain at record levels through August, with
                   sales up by nearly 10% for the month and nearly 14% for the year. The average price of those sales was up by a
                   sharp 7.0% in August and the average through the first nine months of the year is up by a healthy 3.8%. The real
                   (inflation-adjusted) total dollar volume of residential real estate sales remains deep into record territory
                   through August up by over 15% compared to a year ago.
                   - About 6,400 jobs were added over the last 12 months (August 2018 to August 2019) for a growth rate of 2.4%;
                   the McAllen city unemployment rate continues its steady decline at 4.3% compared to 4.9% in  August 2018.
                                                           -320-