Page 57 - Approved Annual Budget FY 2019-2020_Flat
P. 57

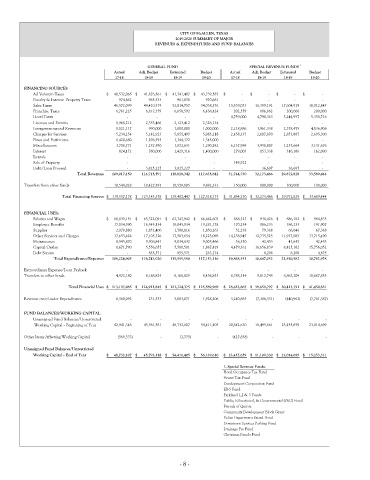
CITY OF McALLEN, TEXAS
                                                           2019-2020 SUMMARY OF MAJOR
                                                    REVENUES & EXPENDITURES AND FUND BALANCES


                                                  GENERAL FUND                      SPECIAL REVENUE FUNDS  1
                                       Actual  Adj. Budget  Estimated  Budget  Actual  Adj. Budget  Estimated  Budget
                                       17-18     18-19    18-19     19-20    17-18    18-19    18-19    19-20
         FINANCING SOURCES
            Ad Valorem Taxes        $       40,532,065 $        41,876,561 $       41,741,487 $       43,739,587  $                 -   $                 -  $                 -   $                  -
            Penalty & Interest  Property Taxes                974,662                965,533               961,050               970,661                     -                      -                     -                       -
            Sales Taxes                      46,572,099           49,410,339          52,814,757          54,038,536         15,539,033        16,399,191        17,604,919         18,012,845
            Franchise Taxes                    6,761,225             6,817,359            6,658,592            6,438,424             202,559              186,662             200,000             200,000
            Hotel Taxes                                   -                         -                       -                       -           4,759,000         4,790,363          5,244,997           5,350,716
            Licenses and Permits               1,968,212             2,353,466            2,123,412            2,328,134                     -                      -                     -                       -
            Intergovernmental Revenues             1,021,117                990,000            1,000,000            1,000,000           2,218,886         3,961,338          2,378,479           4,036,906
            Charges for Services               5,234,154             5,142,923            5,057,497            5,085,218           2,458,337         2,687,070          2,853,887           2,695,300
            Fines and Forfeitures              1,420,680             1,296,593            1,344,372            1,345,000                     -                      -                     -                       -
            Miscellaneous                      3,708,771             1,257,590            1,872,631            1,290,282           6,137,989         3,958,807          1,237,664           3,131,676
            Interest                              824,171                780,000            1,429,316            1,400,000             279,003              153,338             316,186             162,000
            Rentals                                       -                         -                       -                       -                     -                      -                     -                       -
            Sale of Property                              -                         -                       -                       -             149,922                      -                     -                       -
            Debt/Loan Proceed                             -              3,825,227            3,825,227                      -                     -                36,697               36,697                     -
                           Total Revenues        109,017,150         114,715,591        118,828,342        117,635,842         31,744,730       32,173,466        29,872,829        33,589,444

         Transfers from other funds           10,540,028           10,427,787          10,579,105            9,882,333             150,000              100,000             100,000             100,000

                      Total Financing Sources $     119,557,178 $      125,143,378 $     129,407,447 $     127,518,175  $     31,894,730 $     32,273,466 $     29,972,829 $      33,689,444


         FINANCIAL USES:
            Salaries and Wages      $       60,839,151 $        65,322,091 $       62,747,942 $       66,662,607  $          888,323 $         938,426 $          886,182 $          984,833
            Employee Benefits                17,034,590           16,545,134          18,045,134          19,281,178             170,254              186,233             186,233             191,907
            Supplies                           2,079,880             1,851,400            1,788,116            1,850,163               52,138                79,368               66,046               67,368
            Other Services and Charges           17,653,626           17,105,326          17,583,654          18,223,098         14,238,945        12,735,525        11,937,085         13,715,490
            Maintenance                        8,945,870             9,506,841            9,034,632            9,005,466               36,530                42,453               41,647               42,453
            Capital Outlay                     1,671,790             5,556,657            5,500,501            1,867,429           4,479,361        16,656,839          8,425,182         15,756,052
            Debt Service                                  -                 855,571               855,571               263,174                     -                  8,208                8,208                 4,875
                   Total Expenditures/Expenses        108,224,905         116,743,020        115,555,550        117,153,116         19,865,551       30,647,052        21,550,582        30,762,978
         Extraordinary Expense/Loan Payback                         -                         -                       -                       -                     -                      -                     -                       -
         Transfers to other funds              4,972,180             8,168,825            8,168,825            8,436,853           8,788,314         9,012,745          8,863,209         10,687,853

                        Total Financial Uses $     113,197,085 $      124,911,845 $     123,724,375 $     125,589,969  $     28,653,865 $    39,659,797 $     30,413,791 $      41,450,831
         Revenue over/under Expenditures             6,360,092                231,533            5,683,071            1,928,206           3,240,865        (7,386,331)            (440,962)         (7,761,387)

         FUND BALANCES/WORKING CAPITAL
                                                      -
            Unassigned Fund Balances/Unrestricted                           -                                                      -                          -                         -                        -                        -                         -
             Working Capital -- Beginning of Year           42,941,348           45,561,581          48,732,107          54,411,405         20,642,630        18,495,661        23,455,659         23,014,699
         Other Items Affecting Working Capital               (569,333)                                            (3,775)                          -            (427,838)                          -                        -                         -
                                                      -
         Unassigned Fund Balances/Unrestricted
            Working Capital -- End of Year  $       48,732,107 $        45,793,118 $       54,411,405 $       56,339,610  $     23,455,659 $    11,109,330 $     23,014,699 $      15,253,311
                                                                           1. Special Revenue Funds:
                                                                           Hotel Occupancy Tax Fund
                                                                           Venue Tax Fund
                                                                           Development Corporation Fund
                                                                           EB-5 Fund
                                                                           Parkland 1,2 & 3 Funds
                                                                           Public, Educational, & Governmental (PEG) Fund
                                                                           Friends of Quinta
                                                                           Community Development Block Grant
                                                                           Police Department Seized Fund
                                                                           Downtown Services Parking Fund
                                                                           Drainage Fee Fund
                                                                           Christmas Parade Fund


                                                             - 8 -
   52   53   54   55   56   57   58   59   60   61   62