
Page 59 - Approved Annual Budget FY 2019-2020_Flat
P. 59
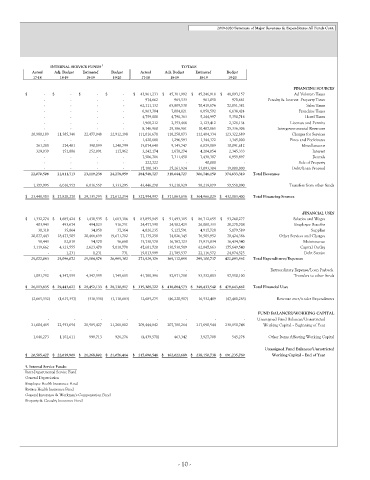
2019-2020 Summary of Major Revenues & Expenditures All Funds Cont.


                  INTERNAL SERVICE FUNDS  5                  TOTALS
            Actual  Adj. Budget  Estimated  Budget  Actual  Adj. Budget  Estimated  Budget
            17-18    18-19    18-19   19-20     17-18    18-19     18-19    19-20
                                                                                                  FINANCING SOURCES
         $                  -  $                 -  $                  -  $                 -  $       43,961,233  $       45,381,992  $       45,246,918  $      48,893,157   Ad Valorem Taxes
                             -                     -                      -                     -               974,662                965,533                961,050                970,661   Penalty & Interest  Property Taxes
                             -                     -                      -                     -           62,111,132           65,809,530           70,419,676          72,051,381   Sales Taxes
                             -                     -                      -                     -            6,963,784             7,004,021             6,858,592             6,638,424   Franchise Taxes
                             -                     -                      -                     -            4,759,000             4,790,363             5,244,997             5,350,716   Hotel Taxes
                             -                     -                      -                     -            1,968,212             2,353,466             2,123,412             2,328,134   Licenses and Permits
                             -                     -                      -                     -            8,146,960            29,386,961           10,487,865          75,336,306   Intergovernmental Revenues
                20,980,189        21,385,346        22,477,048       22,912,198         111,016,671         118,258,873         112,404,334        123,322,689   Charges for Services
                             -                     -                      -                     -            1,420,680             1,296,593             1,344,372             1,345,000   Fines and Forfeitures
                     761,280            274,481             390,099         1,248,799           15,074,648            9,145,747             6,879,189           10,091,612   Miscellaneous
                     329,039            151,886             252,091            117,962            3,242,174             1,678,274             4,204,054             2,345,333   Interest
                             -                     -                      -                     -            7,506,706             7,311,450             7,438,387             6,959,897   Rentals
                             -                     -                      -                     -               222,722                            -                  40,000                           -   Sale of Property
                             -                     -                      -                     -           17,180,143           25,261,924           33,093,304          19,000,000   Debt/Loan Proceed
                22,070,508       21,811,713        23,119,238       24,278,959         284,548,727        318,644,727        306,746,150        374,633,310  Total Revenues

                  1,377,995         6,016,557          6,016,557         3,333,295           43,446,270           53,218,929           58,219,879          57,550,090   Transfers from other funds

         $     23,448,503   $    27,828,270   $     29,135,795 $    27,612,254  $     327,994,997 $     371,863,656 $     364,966,029 $     432,183,400  Total Financing Sources


                                                                                                     :FINANCIAL USES
         $       1,332,274 $       1,685,424 $       1,430,535 $      1,683,306  $       83,855,945  $       91,493,315  $       86,712,655  $      93,260,277   Salaries and Wages
                     403,943            493,674             494,023            516,751           24,477,591           24,582,425           26,080,333          28,270,708   Employee Benefits
                       30,318              35,864               34,050              37,364            4,826,235             5,127,591             4,917,728             5,179,589   Supplies
                20,077,443        18,473,505        20,466,699       19,671,712           77,135,258           74,826,345           76,509,952          78,424,386   Other Services and Charges
                       58,443              82,819               54,570              56,660           15,738,578           16,767,123           15,915,834          16,434,540   Maintenance
                  3,119,662         4,323,555          2,623,470         5,018,778           47,681,720         130,530,519           62,847,663        175,649,540   Capital Outlay
                                 -                  1,231                 1,231                    731            19,813,999           21,785,537           22,116,572          24,874,523   Debt Service
                25,022,083       25,096,072        25,104,578       26,985,302         273,529,326        365,112,855        295,100,737        422,093,562  Total Expenditures/Expenses

                                                               -
                                                                        -
                             -                     -                      -                     -                           -                                                                                -  Extraordinary Expense/Loan Payback
                  1,091,752         4,347,555          4,347,555         1,745,615           41,780,396           52,971,718           53,332,803          57,550,100   Transfers to other funds
         $     26,113,835 $    29,443,627 $     29,452,133 $    28,730,917  $     315,309,722 $     418,084,573 $     348,433,540 $     479,643,662  Total Financial Uses
                 (2,665,332)        (1,615,357)            (316,338)        (1,118,663)          12,685,275         (46,220,917)          16,532,489         (47,460,263)  Revenue over/under Expenditures

                                                                                      FUND BALANCES/WORKING CAPITAL
                                                               -
                                                                        -
                                  -
                                 -                        -                                                -                            -                                                                               -  Unassigned Fund Balances/Unrestricted
                21,604,485        22,553,654        20,585,427       21,268,802         209,444,842        207,780,264        217,690,544        238,150,748   Working Capital -- Beginning of Year
                  1,646,273         1,101,611             999,713            926,276           (4,439,571)                463,342             3,927,708                545,278   Other Items Affecting Working Capital
                                                                                         Unassigned Fund Balances/Unrestricted
         $     20,585,427 $    22,039,909 $     21,268,802 $    21,076,414  $     217,690,548 $     162,022,689 $     238,150,738 $     191,235,769  Working Capital -- End of Year
         5. Internal Service Funds:
         Inter-Departmental Service Fund
         General Depreciation
         Employee Health Insurance Fund
         Retiree Health Insurance Fund
         General Insurance & Workman's Compensation Fund
         Property & Casualty Insurance Fund


                                                            - 10 -