
Page 376 - Budget Book FY2020-2021
P. 376
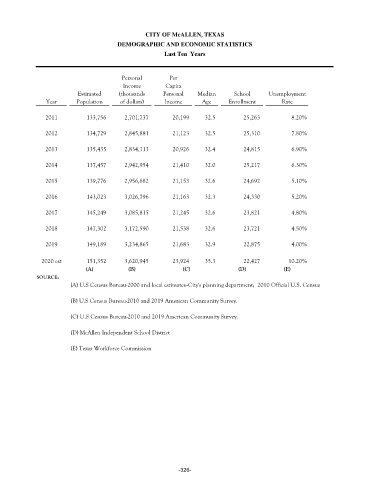
CITY OF McALLEN, TEXAS
                                        DEMOGRAPHIC AND ECONOMIC STATISTICS
                                                       Last Ten  Years


                                         Personal        Per
                                          Income        Capita
                           Estimated    (thousands     Personal   Median      School      Unemployment
                Year      Population     of dollars)   Income       Age      Enrollment       Rate


                2011                133,756          2,701,737              20,199        32.5  25,263   8.20%

                2012                134,729          2,845,881              21,123        32.5  25,310   7.80%

                2013                135,435          2,834,113              20,926        32.4  24,815   6.90%

                2014                137,457          2,942,954             21,410         32.0  25,217   6.30%


                2015                139,776          2,956,682             21,153         32.6  24,692   5.10%

                2016                143,023          3,026,796             21,163         32.3  24,330   5.20%

                2017                145,249          3,085,815             21,245         32.6  23,821   4.80%

                2018                147,302          3,172,590             21,538         32.6  23,721   4.50%


                2019                149,189          3,234,865             21,683         32.9  22,875   4.00%

               2020 est             151,352          3,620,945             23,924         35.3  22,427   10.20%
                             (A)           (B)                (C)               (D)            (E)
             SOURCE:
                        (A) U.S Census Bureau-2000 and local estimates--City's planning department;  2010 Official U.S. Census

                        (B) U.S Census Bureau-2010 and 2019 American Community Survey.


                        (C) U.S Census Bureau-2010 and 2019 American Community Survey.

                        (D) McAllen Independent School District

                        (E) Texas Workforce Commission


                                                            -326-