
Page 58 - Budget Book FY2020-2021
P. 58
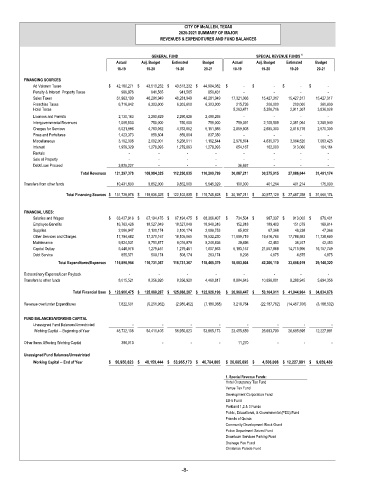
CITY OF McALLEN, TEXAS
                                                            2020-2021 SUMMARY OF MAJOR
                                                      REVENUES & EXPENDITURES AND FUND BALANCES

                                                   GENERAL FUND                       SPECIAL REVENUE FUNDS   1
                                        Actual  Adj. Budget  Estimated  Budget  Actual  Adj. Budget  Estimated  Budget
                                        18-19    19-20     19-20     20-21    18-19     19-20    19-20    20-21
         FINANCING SOURCES
            Ad Valorem Taxes         $      42,160,271 $      43,513,232 $       43,513,232 $       44,994,082  $    -    $   -    $   -    $   -
            Penalty & Interest  Property Taxes    989,976  941,565    941,565    950,431  -    -    -        -

            Sales Taxes                        51,963,199            46,281,949           46,281,949           46,281,949          17,321,066             15,427,317         15,427,317          15,427,317
            Franchise Taxes                      6,716,042  6,303,000             6,303,000             6,303,000               215,736  200,000                200,000  200,000

            Hotel Taxes                     -        -         -        -             5,263,471  5,350,716             2,911,307            3,836,028

            Licenses and Permits                 2,130,163  2,290,629             2,290,628             2,490,265  -    -    -    -
            Intergovernmental Revenues              1,005,503  750,000    750,000  750,000               759,391  2,105,509             2,351,064            2,289,940


            Charges for Services                 6,021,986    4,763,052             4,763,052             5,151,985            2,859,808  2,695,300             2,818,776            2,570,300
            Fines and Forfeitures                1,423,373  859,804  859,804    837,350  -    -     -        -


            Miscellaneous                        3,102,306    2,002,001             5,268,511             1,162,644            2,976,874  4,635,073             3,064,520            7,063,425
            Interest                             1,959,329    1,279,093             1,279,093             1,279,093               654,167  162,000                313,060  104,164
            Rentals                         -        -         -        -         -         -       -        -
            Sale of Property                -        -         -        -         -         -       -        -
            Debt/Loan Proceed                    3,825,227  -    -      -         36,697    -       -        -
                            Total Revenues         121,297,378          108,984,325         112,250,835         110,200,799          30,087,211             30,575,915         27,086,044          31,491,174
         Transfers from other funds            10,431,600    9,852,000             9,852,000             5,545,029               100,000  401,214                401,214  175,000
                       Total Financing Sources $      131,728,978 $      118,836,325 $      122,102,835 $      115,745,828  $      30,187,211 $       30,977,129 $      27,487,258 $       31,666,174

         FINANCIAL USES:
            Salaries and Wages       $      63,427,918 $      67,194,475 $       67,194,475 $       68,366,407  $        734,504 $       987,337   $        913,002 $       979,401
            Employee Benefits                  16,763,426            18,527,049           18,527,049           18,948,316               152,918  189,403                151,079  169,814
            Supplies                             2,086,947    2,100,174             2,100,174             2,098,753    65,802  67,368     46,238  47,368
            Other Services and Charges            17,784,482            17,370,167           18,105,065           18,532,230          11,899,719             19,416,786         17,786,583          11,738,660


            Maintenance                          9,524,531  9,751,877             9,016,979             9,248,836  39,496  42,453     38,247  42,453

            Capital Outlay                       5,448,078  1,279,451             1,279,451             1,007,663            5,183,157             21,557,888         14,715,995          16,157,749

            Debt Service                   855,571    508,174  508,174  263,174    8,208  4,875      4,875  4,875

                    Total Expenditures/Expenses         115,890,954          116,731,367         116,731,367         118,465,379          18,083,804             42,266,110         33,656,019          29,140,320
         Extraordinary Expense/Loan Payback   -      -         -        -         -         -       -        -
         Transfers to other funds                8,015,521  8,356,920             8,356,920             4,460,817            8,884,643             10,898,801           8,288,945            5,694,356

                         Total Financial Uses $      123,906,475 $      125,088,287 $      125,088,287 $      122,926,196  $      26,968,447 $       53,164,911 $      41,944,964 $       34,834,676
         Revenue over/under Expenditures              7,822,501             (6,251,962)            (2,985,452)            (7,180,368)            3,218,764           (22,187,782)       (14,457,706)          (3,168,502)
         FUND BALANCES/WORKING CAPITAL
            Unassigned Fund Balances/Unrestricted  -    -       -         -        -         -        -        -
             Working Capital -- Beginning of Year            48,732,108            54,411,405           56,950,623           53,965,173          23,455,659             26,693,790         26,685,695          12,227,991
         Other Items Affecting Working Capital    396,013  -    -         -     11,270       -        -        -

         Unassigned Fund Balances/Unrestricted
            Working Capital -- End of Year  $      56,950,623 $       48,159,444 $      53,965,173 $      46,784,805  $    26,685,695 $      4,506,008 $    12,227,991 $       9,059,489

                                                                            1. Special Revenue Funds:
                                                                            Hotel Occupancy Tax Fund
                                                                            Venue Tax Fund
                                                                            Development Corporation Fund
                                                                            EB-5 Fund
                                                                            Parkland 1,2 & 3 Funds
                                                                            Public, Educational, & Governmental (PEG) Fund
                                                                            Friends of Quinta
                                                                            Community Development Block Grant
                                                                            Police Department Seized Fund
                                                                            Downtown Services Parking Fund
                                                                            Drainage Fee Fund
                                                                            Christmas Parade Fund


                                                             -8-