
Page 60 - Budget Book FY2020-2021
P. 60
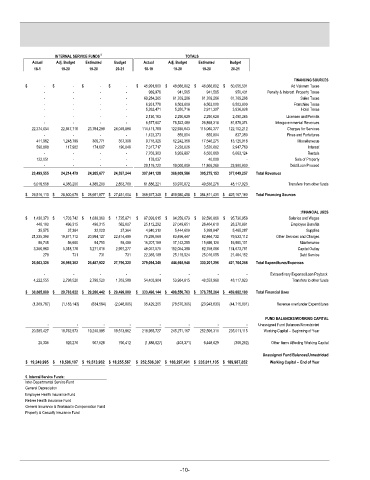
INTERNAL SERVICE FUNDS   5                 TOTALS
            Actual  Adj. Budget  Estimated  Budget  Actual  Adj. Budget  Estimated  Budget
            18-1     19-20     19-20   20-21     18-19    19-20     19-20     20-21
                                                                                                  FINANCING SOURCES
         $      -    $   -    $   -     $   -    $      45,991,600  $       48,666,802  $       48,666,802  $      50,055,531   Ad Valorem Taxes

                -        -        -        -        989,976    941,565  941,565  950,431   Penalty & Interest  Property Taxes
                -        -        -        -              69,284,265            61,709,266            61,709,266           61,709,266   Sales Taxes
                -        -        -        -                6,931,778              6,503,000              6,503,000             6,503,000   Franchise Taxes
                -        -        -        -                5,263,471              5,350,716              2,911,307             3,836,028   Hotel Taxes
                -        -        -        -                2,130,163              2,290,629              2,290,628             2,490,265   Licenses and Permits
                -        -        -        -                6,577,607            76,322,480            26,868,318           81,878,374   Intergovernmental Revenues
                 22,374,654            22,847,718         23,784,299        24,049,888          114,411,788          122,935,043          115,060,377         122,152,212   Charges for Services

                -        -        -        -                1,423,373    859,804  859,804  837,350   Fines and Forfeitures
               411,962              1,248,799              306,771             357,308              9,718,326            12,242,358            17,546,275           13,125,916   Miscellaneous
               590,888  117,962                174,607             190,048              7,317,717              2,228,026              3,520,682             2,947,760   Interest
                -        -        -        -                7,703,303              6,959,897              6,550,869             6,663,124   Rentals


               122,051   -        -        -      178,037      -      40,000       -               Sale of Property
                -        -        -        -              29,119,722            19,000,000            11,806,260           23,900,000   Debt/Loan Proceed
                 23,499,555            24,214,479         24,265,677        24,597,244          307,041,128         366,009,586         305,275,153         377,049,257  Total Revenues
                   6,016,558              4,386,200           4,386,200          2,853,760            61,886,221            53,970,872            49,536,278           48,117,923   Transfers from other funds

         $      29,516,113 $       28,600,679 $      28,651,877 $     27,451,004  $      368,927,349 $      419,980,458 $      354,811,431 $      425,167,180  Total Financing Sources

                                                                                                    :FINANCIAL USES
         $      1,430,370 $       1,703,742   $       1,638,360 $       1,725,871  $       87,093,615  $       94,259,073  $       92,590,866  $      95,736,958   Salaries and Wages
               448,100  496,315                496,315             562,007            25,112,292            27,049,651            26,404,610           28,270,891   Employee Benefits


                35,575  37,364   32,023  37,364              4,940,310              5,444,600              5,268,847             5,485,287   Supplies
                 21,335,396            19,671,712         20,994,127        22,414,490            75,298,069            83,496,447            82,464,732           79,533,112   Other Services and Charges


                56,745  56,660   54,750  58,480            16,207,189            17,142,255            15,698,120           16,580,101   Maintenance
                   3,356,860              5,018,778           3,271,616          2,997,277            48,057,575          192,054,398            82,758,066         174,673,761   Capital Outlay


               278       731      731     731            22,385,189            25,119,524            25,016,055           21,484,152   Debt Service
                 26,663,325            26,985,302         26,487,922        27,796,220          279,094,240         444,565,948         330,201,296         421,764,258  Total Expenditures/Expenses
                -        -        -        -          -        -         -         -      Extraordinary Expense/Loan Payback
                   4,222,555              2,798,520           2,798,520          1,703,589            54,403,904            53,984,815            48,553,968           48,117,923   Transfers to other funds
         $      30,885,880 $       29,783,822 $      29,286,442 $     29,499,809  $      333,498,144 $      498,550,763 $      378,755,264 $      469,882,180  Total Financial Uses
                  (1,369,767)            (1,183,143)             (634,564)         (2,048,805)           35,429,205          (78,570,305)          (23,943,833)          (44,715,001)  Revenue over/under Expenditures

                                                                                         FUND BALANCES/WORKING CAPITAL
                 -        -        -        -         -        -         -         -    Unassigned Fund Balances/Unrestricted
                 20,585,427            18,762,973         19,240,995        19,513,962          218,965,727         245,271,167         252,506,311         235,011,115   Working Capital -- Beginning of Year
                25,335  926,276                907,528             790,412            (1,888,627)                (403,371)               6,448,629               (308,262)   Other Items Affecting Working Capital

                                                                                        Unassigned Fund Balances/Unrestricted
         $    19,240,995 $       18,506,107 $    19,513,962 $   18,255,567  $    252,506,307 $    166,297,491 $    235,011,105 $    189,987,852  Working Capital -- End of Year

         5. Internal Service Funds:
         Inter-Departmental Service Fund
         General Depreciation
         Employee Health Insurance Fund
         Retiree Health Insurance Fund
         General Insurance & Workman's Compensation Fund
         Property & Casualty Insurance Fund


                                                             -10-