
Page 359 - Applied Statistics with R
P. 359
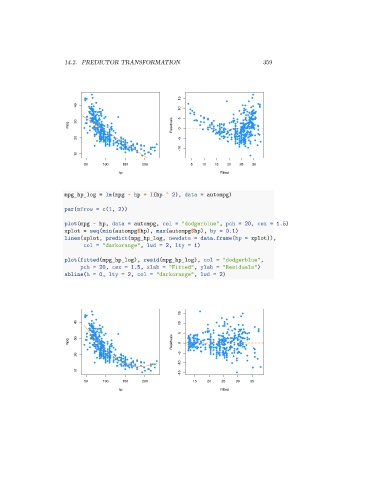
14.2. PREDICTOR TRANSFORMATION                                    359


                                                             15
                          40
                                                             10

                          30                                 5
                        mpg                               Residuals  0
                          20                                 -5
                                                             -10
                          10

                             50    100    150   200             5   10  15  20  25  30
                                        hp                                Fitted


                      mpg_hp_log = lm(mpg ~ hp + I(hp ^ 2), data = autompg)
                      par(mfrow = c(1, 2))


                      plot(mpg ~ hp, data = autompg, col = "dodgerblue", pch = 20, cex = 1.5)
                      xplot = seq(min(autompg$hp), max(autompg$hp), by = 0.1)
                      lines(xplot, predict(mpg_hp_log, newdata = data.frame(hp = xplot)),
                             col = "darkorange", lwd = 2, lty = 1)

                      plot(fitted(mpg_hp_log), resid(mpg_hp_log), col = "dodgerblue",
                            pch = 20, cex = 1.5, xlab = "Fitted", ylab = "Residuals")
                      abline(h = 0, lty = 2, col = "darkorange", lwd = 2)


                                                             15
                          40                                 10
                                                             5
                          30
                        mpg                               Residuals  0

                          20                                 -5
                                                             -10
                          10
                                                             -15
                             50    100    150   200              15   20  25   30   35
                                        hp                                Fitted