Page 362 - Applied Statistics with R
P. 362

362                              CHAPTER 14. TRANSFORMATIONS
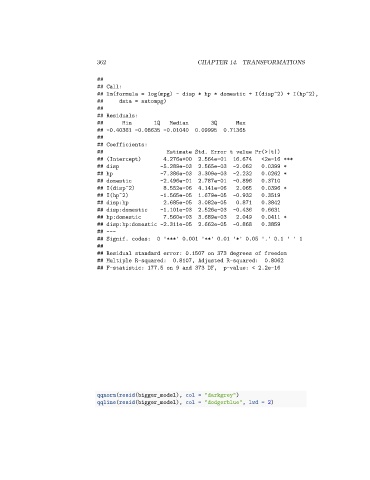

                                 ##
                                 ## Call:
                                 ## lm(formula = log(mpg) ~ disp * hp * domestic + I(disp^2) + I(hp^2),
                                 ##     data = autompg)
                                 ##
                                 ## Residuals:
                                 ##       Min       1Q   Median        3Q      Max
                                 ## -0.40381 -0.08635 -0.01040    0.09995  0.71365
                                 ##
                                 ## Coefficients:
                                 ##                     Estimate Std. Error t value Pr(>|t|)
                                 ## (Intercept)        4.276e+00   2.564e-01  16.674    <2e-16 ***
                                 ## disp              -5.289e-03   2.565e-03  -2.062    0.0399 *
                                 ## hp                -7.386e-03   3.309e-03  -2.232    0.0262 *
                                 ## domestic          -2.496e-01   2.787e-01  -0.896    0.3710
                                 ## I(disp^2)          8.552e-06   4.141e-06   2.065    0.0396 *
                                 ## I(hp^2)           -1.565e-05   1.679e-05  -0.932    0.3519
                                 ## disp:hp            2.685e-05   3.082e-05   0.871    0.3842
                                 ## disp:domestic     -1.101e-03   2.526e-03  -0.436    0.6631
                                 ## hp:domestic        7.560e-03   3.689e-03   2.049    0.0411 *
                                 ## disp:hp:domestic -2.311e-05    2.662e-05  -0.868    0.3859
                                 ## ---
                                 ## Signif. codes:   0 '***' 0.001 '**' 0.01 '*' 0.05 '.' 0.1 ' ' 1
                                 ##
                                 ## Residual standard error: 0.1507 on 373 degrees of freedom
                                 ## Multiple R-squared:   0.8107, Adjusted R-squared:    0.8062
                                 ## F-statistic: 177.5 on 9 and 373 DF,    p-value: < 2.2e-16


                                 qqnorm(resid(bigger_model), col = "darkgrey")
                                 qqline(resid(bigger_model), col = "dodgerblue", lwd = 2)
   357   358   359   360   361   362   363   364   365   366   367