
Page 451 - Applied Statistics with R
P. 451
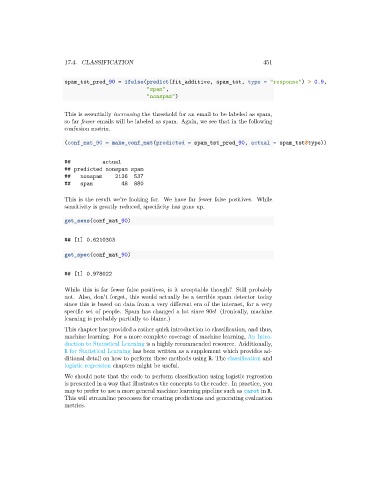
17.4. CLASSIFICATION                                              451


                      spam_tst_pred_90 = ifelse(predict(fit_additive, spam_tst, type = "response") > 0.9,
                                                  "spam",
                                                  "nonspam")


                      This is essentially increasing the threshold for an email to be labeled as spam,
                      so far fewer emails will be labeled as spam. Again, we see that in the following
                      confusion matrix.

                      (conf_mat_90 = make_conf_mat(predicted = spam_tst_pred_90, actual = spam_tst$type))


                      ##           actual
                      ## predicted nonspam spam
                      ##    nonspam    2136  537
                      ##    spam         48  880

                      This is the result we’re looking for. We have far fewer false positives. While
                      sensitivity is greatly reduced, specificity has gone up.

                      get_sens(conf_mat_90)


                      ## [1] 0.6210303

                      get_spec(conf_mat_90)


                      ## [1] 0.978022

                      While this is far fewer false positives, is it acceptable though? Still probably
                      not. Also, don’t forget, this would actually be a terrible spam detector today
                      since this is based on data from a very different era of the internet, for a very
                      specific set of people. Spam has changed a lot since 90s! (Ironically, machine
                      learning is probably partially to blame.)
                      This chapter has provided a rather quick introduction to classification, and thus,
                      machine learning. For a more complete coverage of machine learning, An Intro-
                      duction to Statistical Learning is a highly recommended resource. Additionally,
                      R for Statistical Learning has been written as a supplement which provides ad-
                      ditional detail on how to perform these methods using R. The classification and
                      logistic regression chapters might be useful.
                      We should note that the code to perform classification using logistic regression
                      is presented in a way that illustrates the concepts to the reader. In practice, you
                      may to prefer to use a more general machine learning pipeline such as caret in R.
                      This will streamline processes for creating predictions and generating evaluation
                      metrics.