
Page 88 - ANC-Presentations-Full-18-10_Neat
P. 88
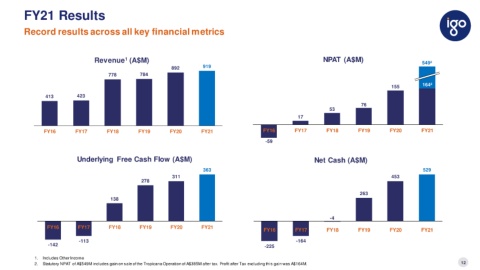
FY21 Results


           Record results across all key financial metrics


                                                        1
                                           Revenue (A$M)                                                    300                                 NPAT (A$M)                                 549 2
          1000                                                               892          919
           900                                   778           784                                          250
           800                                                                                              200
           700                                                                                                                                                                155          164 2
           600                                                                                              150
           500       413           423
           400                                                                                              100                                                 76
           300                                                                                                                                    53
           200                                                                                               50                     17
           100
             0                                                                                                0
                    FY16          FY17          FY18          FY19          FY20          FY21                       FY16          FY17          FY18          FY19          FY20          FY21
                                                                                                             -50
                                                                                                                      -59
                                                                                                            -100

                                   Underlying  Free Cash Flow (A$M)                                                                         Net Cash (A$M)

             400                                                                           363              600                                                                             529
                                                                             311                            500                                                               453
             300                                               278
                                                                                                            400
             200                                                                                            300                                                 263
                                                  138
                                                                                                            200
             100
                                                                                                            100
                                                                                                                                                   -4
               0                                                                                              0
                      FY16         FY17          FY18          FY19         FY20          FY21
                                                                                                            -100     FY16          FY17          FY18          FY19          FY20          FY21
            -100
                                    -113                                                                    -200                    -164
                      -142
            -200                                                                                            -300      -225
                1.  Includes Other Income
                2.  Statutory NPAT of A$549M includes gain on sale of the Tropicana Operation of A$385M after tax. Profit after Tax excluding this gain was A$164M.                                         12