
Page 91 - ANC-Presentations-Full-18-10_Neat
P. 91
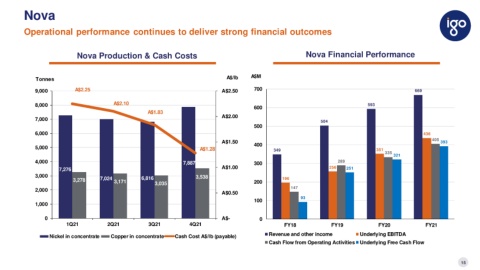
Nova


            Operational performance continues to deliver strong financial outcomes


                                   Nova Production & Cash Costs                                                                         Nova Financial Performance


                 Tonnes                                                                              A$/lb      A$M

                9,000             A$2.25                                                           A$2.50        700                                                                    669


                8,000                              A$2.10                                                        600                                               593
                                                                  A$1.83
                7,000                                                                              A$2.00                                     504
                                                                                                                 500
                6,000                                                                                                                                                                       436
                                                                                                   A$1.50                                                                                       405  393
                5,000                                                                    A$1.28                  400      349                                          351
                                                                                                                                                                           335
                                                                                                                                                                               321
                4,000                                                             7,887                          300                                  289
                           7,276                                                                   A$1.00                                         256     251
                3,000                                                                  3,538
                                 3,278       7,024  3,171      6,816  3,035                                      200         196

                2,000                                                                                                            147
                                                                                                   A$0.50
                                                                                                                                      93
                                                                                                                 100
                1,000

                     0                                                                             A$-             0
                              1Q21              2Q21              3Q21               4Q21                                     FY18                 FY19                 FY20                 FY21

                       Nickel in concentrate      Copper in concentrate       Cash Cost A$/lb (payable)                 Revenue and other income                Underlying EBITDA
                                                                                                                        Cash Flow from Operating Activities Underlying Free Cash Flow


                                                                                                                                                                                                            15