
Page 52 - ATR 5 2019 digital
P. 52
S TAT VIE W
Operational Costs of Trucking
Total Average Cost Per Mile in 2018
Operational Costs of Trucking
Total Average Cost Per Mile in 2018
$1.82
$1.82
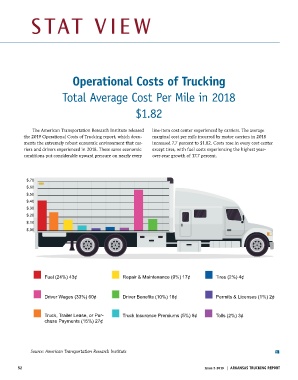
The American Transportation Research Institute released line-item cost center experienced by carriers. The average
the 2019 Operational Costs of Trucking report, which docu- marginal cost per mile incurred by motor carriers in 2018
The American Transportation Research Institute released the 2019 Operational Costs of Trucking report, which docu-
ments the extremely robust economic environment that car- increased 7.7 percent to $1.82. Costs rose in every cost center
ments the extremely robust economic environment that carriers and drivers experienced in 2018. These same economic
riers and drivers experienced in 2018. These same economic except tires, with fuel costs experiencing the highest year-
conditions put considerable upward pressure on nearly every line-item cost center experienced by carriers. The average
conditions put considerable upward pressure on nearly every over-year growth of 17.7 percent.
marginal cost per mile incurred by motor carriers in 2018 increased 7.7 percent to $1.82. Costs rose in every cost center
except tires, with fuel costs experiencing the highest year-over-year growth of 17.7 percent.
$.70
$.60
$.50
$.40
$.30
$.20
$.10
$.00
Fuel (24%) 43¢ Repair & Maintenance (9%) 17¢ Tires (2%) 4¢
Driver Wages (33%) 60¢ Driver Benefits (10%) 18¢ Permits & Licenses (1%) 2¢
Truck, Trailer Lease, or Pur- Truck Insurance Premiums (5%) 8¢ Tolls (2%) 3¢
chase Payments (15%) 27¢
Source: American Transportation Research Institute
Source: American Transportation Research Institute ATR
52 Issue 5 2019 | ARKANSAS TRUCKING REPORT