
Page 180 - APPLIED PROCESS DESIGN FOR CHEMICAL AND PETROCHEMICAL PLANTS, Volume 1, 3rd Edition
P. 180
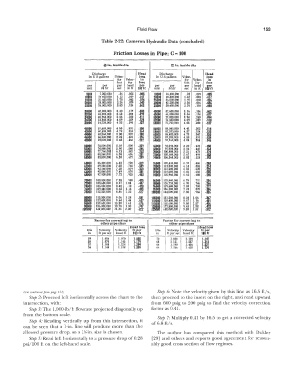
Fluid Flow                                           153

                                            Table 2-22: Cameron Hydraulic Data (concluded)

                                                 Friction Losses in Pipe; C =-100


                                            60 in. Inside d la           72  in. inside dla
                                        Discharge          Head     Discharge          Head
                                      in US gallons   Vc!oc-   loss   in US gallons   Veloc-   Ioss
                                                  ity   Veloc-   In           ity  Veloc-   in
                                                  feet   ity   feet           feet   ity   feet
                                      I'<;'   per   per   head   per   per   per   per   head
                                                                                       1&i'lt
                                     mm    24 hr   sec   --  --   min   24 hr   sec   --  --
                                                      in ft  100 ft
                                                                                   in ft
                                     5000   7,200,000   .56   .005   .003   10000   14,400,000   .78   .009   .005
                                     10000   IH00,000   1.12   .019   .011   20000   28,800,000   1.57   .038   .011
                                     16000   21,600,000   1.70   .045   .024   25000   36,000,000   1. 97   .060   .02,
                                     20000   28,800,000   2.26   .079   .042   30000   43,200,000   2.36   .086   .036
                                     25000   36,000,000   2.83   .124   .062   35000   50,400,000   2. 76   .118   .048
                                     30000   43,200,000   3.40   .179   -088   40000   57,600,000   3.16   .154   .062
                                     32000   46,080,000   3.63   .205   -09'   45000   64,800,000   3.54   .194   .011
                                     34000   48,960,000   3.86   .230   .111   5 � 000   72,000,000   3.94   .240   -094
                                    36000   51,840,000   4.09   .259   -124   5  000   74,880,000   4.09   .259   .100
                                    38000   54,720,000   4.32   .290   .137   54000   77,760,000   4.25   .280   ,107
                                    40000   57,600,000   4.55   .320   -150   56000   80,540,000   4.41   .302   -114
                                    42000   60,480,000   4. 78   .354   -164   58000   83,520,000   4.57   .324   .122
                                    44000   63,360,000   5.00   .387   -180   60000   86,400,000   4.73   .347   .130
                                    46000   66,240,000   5.22   .422   .196   62000   89,280,000   4.88   .370   -138
                                    48000   69,020,000   5.45   .460   .212   64000   92,160,000   5.04   .384   .146
                                    50000   72,000,000   5.68   .500   .229   66000   95,040,000   5.20   .420   .165
                                    52000   74,880,000   5.90   .540   -246   68000   97,920,000   5.36   .447   -164
                                    54000   77,760,000   6.12   .582   .263   70000  100,800,000   5.51   .473   .174
                                    56000   80,540,000   6.35   .626   .281   72000  103,680.000   5.67   .499   -183
                                                      .672  .m
                                    68000   83,520,000   6.68    74000  106,560,000   5.83   .528   .193
                                    60000   86,400,000   6.81   . 720   -319   76000  109,440,000   5. 99   .558   .203
                                    62000   89,280,000   7.03   . 768   .339   78000  11%,320,000   6.15   .588   -214
                                    64000   92,160,000   7.25   .819   .360   80000  115,200,000   6.31   .620   .225
                                    66000   95,040,000   7.49   .870   .381   82000  118,080,000   6.46   .650   .235
                                    68000   97,920,000   7. 72   . 925   -403   84000  120,960,000   6. 62   .680   .245
                                    70000   100,800,000   7.95   .980   -425   86000  123,840,000   6. 78   . 712   .256
                                    72000   103,680,000   8.17   1.04   .447   88000  126,720,000   6. 93   . 746   -266
                                    74000   106,560,000   8.40   .10   -470   9b000  129,600,000   7.09   . 780   .277
                                    76000   109,440,000   8.62   1.15   .493   i5000   136,800,000   7. 49   .870   -30f
                                    78000   112,320,000   8.86   1.22   .517   1  0000  144,000,000   7. 88   .965   .33
                                    80000   115,200,000   9.06   1.28   .541   105000  151,200,000   8.28   1.06   .367
                                    85000   122,400,000   9.64   i.44   .607   110000  15R,400,000   8. 67   1.16   -401
                                    ,0000   129,600,000   10.20   I. 61   -676   1!5000  165.600,000   9.05   1.27   .,m
                                    95000   136,800,000   10. 78   1.80   .747   1  0000  112,roo,ooo   9. 45   1.38   .473
                                    100000   144,000,000   11.36   2.00   .822   125000  i80,  00,000  I  9.85   1.51   .512
                                         Factor for correcrtng to   --Factor for correct  ing to
                                           other pipe size•             other pipe sizes
                                                       Head 1088                    Head Ioss
                                      Dia   Velocity   Velocity   ft per   Dia   Velocity  Velocity   ft per
                                          ft per sec
                                                                   iu
                                                                       ft  per sec  head ft
                                                                                      100 ft
                                      in
                                    ---- ---      head ft   100 ft   ---  ---  ---  ----
                                      59    1.034   1.070   1-085   70   1.058   1.119   1-147
                                      58    1.070   1.145   1.179   68   1.121   1.257   1-3!8
                                      57    1.108   1.228   1.284   66   1.190   1.416   1-5  7
                                      56    1.148   1.318   I   1.399   64   l.266   1. 602   1-774
           (text continued Jro11,.  page  141)                     Step  6:  Note  the velocity given by  this  line as  16.5  ft/s,
             Step  2: Proceed left horizontally across  the chart to  the   then proceed to the insert on the right,  and read upward
           intersection, with:                                  from  600  psig  to  200  psig  to  find  the velocity  correction
             Step 3: The  1,000-lb/h flowrate projected diagonally up   factor as 0.41.
           from the bottom scale.
                                                                   Step  7:  Multiply 0.41  by  16.5 to get a  corrected velocity
             Step  4:  Reading  vertically  up  from  this  intersection,  it   of 6.8 ft/s.
           can  be seen  that a  Lin.  line will  produce  more  than  the
           allowed  pressure drop,  so a  1!1,--in.  size is chosen.   The  author  has  compared  this  method  with  Dukler
             Step 5: Read left  horizontally  to a pressure drop of 0.28   [29]  and others  and reports  good agreement for reason-
           psi/100 ft on  the left-hand scale.                   ably good cross section of flow  regimes.