Page 63 - APPLIED PROCESS DESIGN FOR CHEMICAL AND PETROCHEMICAL PLANTS, Volume 1, 3rd Edition
P. 63

48                       Applied Process Design for Chemical  and Petrochemical  Plants


                                                                                        Return  "'
                                                                   (Gross savings  -Depreciation x Investment) (I-Federal Tax)
                                                                                       Investment
             where   12  =  index value for year represented by 2,  (usually   Example  1-2: Justifiable Investment For Annual
                        current)                                   Savings  [6]
                     1 1  = index value for earlier year represented by  l.
                   EC 2  = equipment estimated  cost for year  represented   Find  the justifiable  investment for a  gross  annual  sav-
                        by 2.                                      ings of $15,000 when a  return of 10%  and a  depreciation
                   EC 1  = equipment purchased cost (when available)  for
                        year represented by  I.                    rate of 15 percent are  specified.

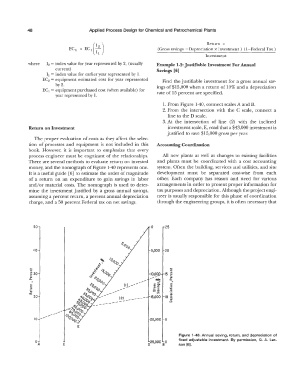
                                                                     1. From Figure  1-40,  connect scales A and B.
                                                                     2.  From  the  intersection  with  the  C  scale,  connect  a
                                                                       line to  the D scale.
                                                                     3. At  the  intersection  of  line  (2)  with  the  inclined
             Return on Investment                                      investment scale, E, read that a $43,000 investment is
                                                                       justified to save $15,000 gross per year.
               The  proper evaluation of' costs as  they affect the selec-
             tion  of processes  and  equipment  is  not included  in  this   Accounting Coordination
             book.  However,  it is  important  to  emphasize  that  every
             process  engineer must be  cognizant of the  relationships.   All  new  plants  as  well  as  changes  to  existing facilities
             There are several methods to  evaluate  return on invested   and  plants  must  be  coordinated with  a  cost  accounting
             money,  and the nomograph of  Figure 1-40 represents one.   system.  Often the building,  services and utilities,  and site
             It is a useful guide  [6]  to estimate the order of magnitude   development  must  be  separated  cost-wise  from  each
             of a  return  on  an  expenditure  to  gain  savings  in  labor   other.  Each  company  has  reason  and  need  for various
             and/or material  costs.  The  nomograph  is  used  to  deter-   arrangements in order to present proper information for
             mine  the  investment justified  by  a  gross  annual  savings,   tax purposes and depreciation. Although the project engi-
             assuming a percent return, a percent annual  depreciation   neer is usually responsible for this phase of coordination
             charge, and a 50 percent Federal  tax on net savings.   through the engineering groups, it is often necessary that


               50                                               0     25


               40                                               5,000   20


                                                                        ...
              c:                                                        c
                                                                      15
              �  30                                             _,_  ..
                                                                10, � o.9
                                                                        :::'.
              "'
             a.                                                    ..   Q.  -
                                                                 .. "'   c
                                                                 ..  c
                                                                        0
                                                                 0--
                                                                 ....  >   �
                                                                 (!)  "   ..
                                                                        u
                                                                   CJ)   �
               20                                               15,000   10  Cl.
                                                                        ...
                                                                        0
                    --  ---
               10  --                                           20,000  5
                                 E
                                                                            Figure  1-40.  Annual  saving,  return,  and depreciation  of
                                                                            fixed  adjustable  investment.  By  permission,  G.  A.  Lar-
                           c                                   025,000  80   son  [6].
   58   59   60   61   62   63   64   65   66   67   68