Page 50 - Spotlight A+ SPM Additional Mathematics Form 4 & 5
P. 50

Additional Mathematics    SPM Model Paper
                7.  (a)  Solve the equation of 6 tan  q + 13 sec q = 2 for 0° < q < 360°.        [3 marks]
                                           2
                                                      1
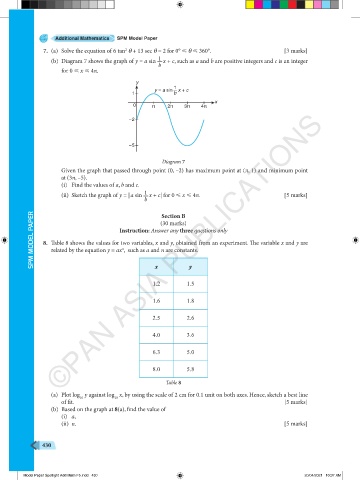
                  (b)  Diagram 7 shows the graph of y = a sin   x + c, such as a and b are positive integers and c is an integer
                                                      b
                     for 0 < x < 4π.
                                              y
                                                           1
                                                    y = a sin— x + c
                                             1             b
                                                                        x
                                             0      π    2π   3π    4π
                     ©PAN ASIA PUBLICATIONS
                                            –2


                                            –5

                                                       Diagram 7
                     Given the graph that passed through point (0, –2) has maximum point at (π, 1) and minimum point
                     at (3π, –5).
                     (i)  Find the values of a, b and c.
                                                 1
                     (ii)  Sketch the graph of y = | a sin   x + c| for 0 < x < 4π.              [5 marks]
                                                 b     Section B

            SPM MODEL PAPER    8.  Table 8 shows the values for two variables, x and y, obtained from an experiment. The variable x and y are
                                                      (30 marks)
                                         Instruction: Answer any three questions only


                                          n
                  related by the equation y = ax ,  such as a and n are constants.
                                                                y
                                                     x

                                                    1.2        1.5


                                                    1.6        1.8

                                                    2.5        2.6


                                                    4.0        3.6

                                                    6.3        5.0


                                                    8.0        5.8

                                                        Table 8
                  (a)  Plot log  y against log  x, by using the scale of 2 cm for 0.1 unit on both axes. Hence, sketch a best line
                                       10
                            10
                     of fit.                                                                   [5 marks]
                  (b)  Based on the graph at 8(a), find the value of
                     (i)  a,
                     (ii)  n.                                                                   [5 marks]


               430


         Model Paper Spotlight Add Math F5.indd   430                                                 20/04/2021   10:37 AM
   45   46   47   48   49   50   51   52   53   54