
Page 10 - 1202 Question Bank Additional Mathematics Form 4
P. 10
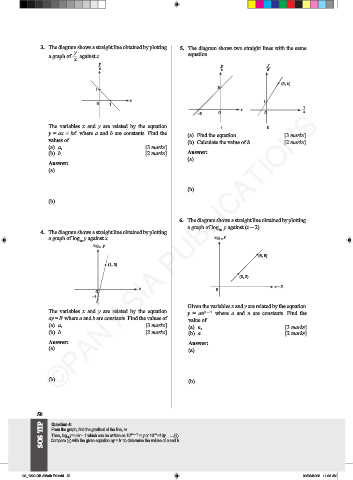
3. The diagram shows a straight line obtained by plotting 5. The diagram shows two straight lines with the same
y
a graph of against x. equation.
x
y y
y
— — –—
x x x 2
(2, h)
3
1
x
0 1
1
1
x —
–3 0 0 x
©PAN ASIA PUBLICATIONS
The variables x and y are related by the equation I II
y = ax + bx where a and b are constants. Find the (a) Find the equation. [3 marks]
2
values of (b) Calculate the value of h. [2 marks]
(a) a, [3 marks]
(b) b. [2 marks] Answer:
(a)
Answer:
(a)
(b)
(b)
6. The diagram shows a straight line obtained by plotting
a graph of log y against (x – 2).
4. The diagram shows a straight line obtained by plotting 10
a graph of log y against x. log y
10
10
log y
10
(6, 5)
(1, 3)
(3, 2)
x – 2
x 0
0
–1
Given the variables x and y are related by the equation
The variables x and y are related by the equation y = an x – 2 where a and n are constants. Find the
ay = b where a and b are constants. Find the values of value of
x
(a) a, [3 marks] (a) n, [3 marks]
(b) b. [2 marks] (b) a. [2 marks]
Answer: Answer:
(a) (a)
(b) (b)
50 Question 4:
SOS TIP From the graph, find the gradient of the line, m. (mx – 1) = y or 10 =10y.....…
mx
Then, log y = mx – 1 which can be written as 10
10
x
Compare with the given equation ay = b to determine the values of a and b.
5050
06_1202 QB AMath F4.indd 50 09/05/2022 11:33 AM