
Page 12 - 1202 Question Bank Additional Mathematics Form 4
P. 12
2
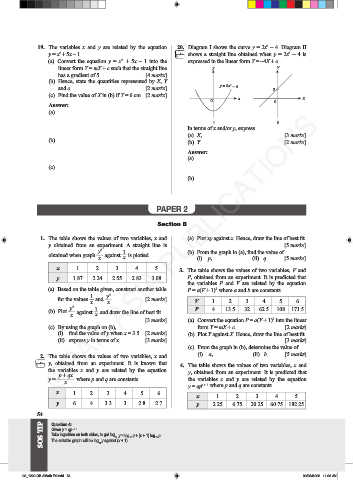
19. The variables x and y are related by the equation 20. Diagram I shows the curve y = 2x – 4. Diagram II
y = x + 5x – 1. SPM shows a straight line obtained when y = 2x – 4 is
2
2
CLONE
(a) Convert the equation y = x + 5x – 1 into the expressed in the linear form Y = –4X + c.
2
linear form Y = mX + c such that the straight line y Y
has a gradient of 5. [4 marks]
(b) Hence, state the quantities represented by X, Y
and c. [2 marks] y = 2x – 4 2
2
(c) Find the value of X in (b) if Y = 6 cm. [2 marks]
x X
Answer: 0 0
(a)
©PAN ASIA PUBLICATIONS
I II
In terms of x and/or y, express
(a) X, [3 marks]
(b) (b) Y. [2 marks]
Answer:
(a)
(c)
(b)
PAPER 2
Section B
1. The table shows the values of two variables, x and (a) Plot xy against x. Hence, draw the line of best fit.
y obtained from an experiment. A straight line is [5 marks]
y 2 1 (b) From the graph in (a), find the value of
obtained when graph x against is plotted. (i) p, (ii) q. [5 marks]
x
x 1 2 3 4 5 3. The table shows the values of two variables, V and
y 1.87 2.24 2.55 2.83 3.08 P, obtained from an experiment. It is predicted that
the variables P and V are related by the equation
(a) Based on the table given, construct another table P = a(V + 1) where a and b are constants.
b
1 y 2
for the values and x . [2 marks] V 1 2 3 4 5 6
x
y 2 1 P
(b) Plot against and draw the line of best fit. 4 13.5 32 62.5 108 171.5
x x
[3 marks] (a) Convert the equation P = a(V + 1) into the linear
b
(c) By using the graph on (b), form Y = mX + c. [2 marks]
(i) find the value of y when x = 3.5. [2 marks] (b) Plot Y against X. Hence, draw the line of best fit.
(ii) express y in terms of x. [3 marks] [3 marks]
(c) From the graph in (b), determine the value of
2. The table shows the values of two variables, x and (i) a, (ii) b. [5 marks]
SPM y, obtained from an experiment. It is known that
CLONE 4. The table shows the values of two variables, x and
the variables x and y are related by the equation y, obtained from an experiment. It is predicted that
p + qx
y = where p and q are constants. the variables x and y are related by the equation
x y = qp x + 1 where p and q are constants.
x 1 2 3 4 5 6 x 1 2 3 4 5
y 6 4 3.3 3 2.8 2.7 y 2.25 6.75 20.25 60.75 182.25
54 Question 4:
SOS TIP Given y = qp x + 1 . 10 10 10 10 5454
Take logarithm on both sides, to get log y = log q + (x + 1) log p
The suitable graph will be log y against (x + 1).
06_1202 QB AMath F4.indd 54 09/05/2022 11:33 AM