
Page 11 - 1202 Question Bank Mathematics Form 4
P. 11
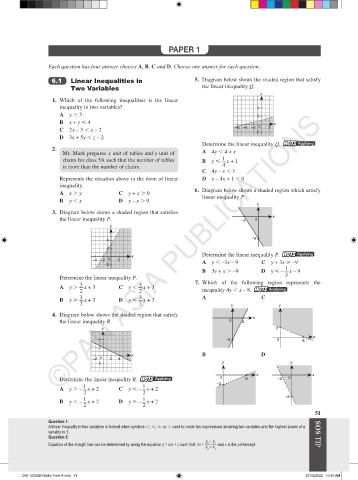
PAPER 1


                  Each question has four answer choices A, B, C and D. Choose one answer for each question.

                   6.1   Linear Inequalities in                        5.  Diagram below shows the shaded region that satisfy
                          Two Variables                                  the linear inequality Q.
                                                                                             y
                    1.  Which of the following inequalities is the linear
                      inequality in two variables?                                          4
                      ©PAN ASIA PUBLICATIONS
                      A  y . 3                                                              2
                      B  x + y < 4                                                                x
                                                                                    –6  –4 –2  0  2
                      C  2x – 3 , x – 2
                                                                                           –2
                      D  3x + 5y , z – 2
                                                                         Determine the linear inequality Q.  HOTS Applying
                    2.
                       Mr. Mark prepares x unit of tables and y unit of   A  4y , 4 + x
                                                                                1
                       chairs for class 5A such that the number of tables   B  y <   x + 1
                       is more than the number of chairs.                       4
                                                                         C  4y – x , 1
                      Represents the situation above in the form of linear   D  y – 4x + 1 , 0
                      inequality.
                                                                       6.  Diagram below shows a shaded region which satisfy
                      A  x . y             C  y + x . 0
                                                                         linear inequality P.
                      B  y , x             D  y – x . 0
                                                                                            y
                    3.  Diagram below shows a shaded region that satisfies
                                                                                                  x
                      the linear inequality P.                                         –3  0
                                        y
                                                                                          –9
                                       4
                                       2
                                                                         Determine the linear inequality P.  HOTS Applying
                                                x
                                  –4 –2  0  2                            A  y , –3x – 9       C  y + 3x > –9
                                      –2
                                                                                                      1
                                                                         B  3y + x . –9       D  y < –   x – 9
                      Determine the linear inequality P.                                              3
                             3                    3                    7.  Which of the  following region represents the
                      A  y .   x + 3       C  y ,   x + 3
                             2                    2                      inequality 4y , x – 8.  HOTS Analysing
                             3                    3                      A                    C
                      B  y >   x + 3       D  y <   x + 3
                             2                    2                                y                y
                    4.  Diagram below shows the shaded region that satisfy
                                                                                           x
                      the linear inequality R.                                    0    2
                                     y                                                             2
                                                                                                                x
                                    4                                            –8                0        8

                                    2
                                                x                        B                    D
                                  –2  0  2  4
                                   –2                                           y                       y

                                                                                            x                   x
                      Determine the linear inequality R.  HOTS Applying        0        8          –2  0
                                                                              –2
                               1                    1
                      A  y . –   x + 2     C  y < –   x + 2
                               2                    2
                                                                                                      –8
                               1                    1
                      B  y , –   x + 2     D  y > –   x + 2
                               2                    2
                                                                                                                 51
                  Question 1:
                  A linear inequality in two variables is formed when symbols ,, <, >, or . used to relate two expressions involving two variables and the highest power of a
                  variable is 1.
                  Question 5:                                                                                    SOS TIP
                  Equation of the straight line can be determined by using the equation y = mx + c such that  m =  y  – y 1   and c is the y-intercept.
                                                                           2
                                                                          x  – x
                                                                           2  1


         C06 1202QB Maths Form 4.indd   51                                                                   21/02/2022   10:45 AM