Page 18 - N.C. A&T Annual Report Fiscal Year 2017
P. 18

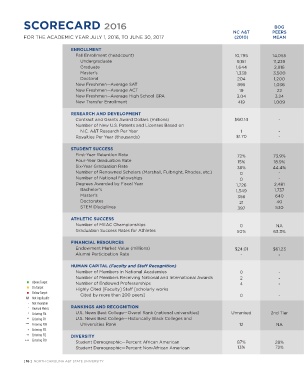
SCORECARD 2016                                                                                 BOG               UNC                                                                                                SELF-
                                                                                         NC A&T         PEERS             PEERS         GOAL         NC A&T        NC A&T         NC A&T        NC A&T         NC A&T        ASSESS-
          FOR THE ACADEMIC YEAR JULY 1, 2016, TO JUNE 30, 2017                            (2010)        MEAN              MEAN          2020       (FALL 2012)    (FALL 2013)   (FALL 2014)    (FALL 2015)   (FALL 2016)      MENT

                            ENROLLMENT
                              Fall Enrollment (headcount)                                 10,795        14,055            23,872       13,500         10,636        10,561         10,725        10,852         11,177          n
                               Undergraduate                                               9,151         11,239           18,786       10,000         8,923         8,872          9,203         9,353          9,668           n
                               Graduate                                                   1,644          2,816            5,086         3,500          1,713         1,689         1,522         1,499          1,509           n
                               Master’s                                                    1,338         3,500             3,399        3,000         1,460          1,390         1,212          1,158         1,058           n
                               Doctoral                                                    204           1,200             673          500            253           299            310           341            381            n
                              New Freshmen—Average SAT                                     895           1,036             1,039        1,040          906           919           920            918           933             n
                              New Freshmen—Average ACT                                      19            22                21           22             19            18            18.7           19            19             n
                              New Freshmen—Average High School GPA                         3.04          3.24              3.60          3.4           3.25          3.34           3.4           3.39          3.48            n
                              New Transfer Enrollment                                      419           1,009             1,759        1,500          409           430            675           641           730             n
                            RESEARCH AND DEVELOPMENT
                              Contract and Grants Award Dollars (millions)                $60.14           -              $43.71         $85          $56.7         $52.75         $53.2          $60           $61.51          n
                              Number of New U.S. Patents and Licenses Based on
                                N.C. A&T Research Per Year                                  1              -                -            14             2             3              2             8             3              n
                              Royalties Per Year (thousands)                               $1.70           -                -           $250            0             $2           $33.5          $24           $60             n

                            STUDENT SUCCESS
                              First-Year Retention Rate                                    72%           73.9%            78.6%         85%           73.6%         79.8%          79%           75% *         75.13% +         n
                              Four-Year Graduation Rate                                    15%           18.9%            28.4%         35%           20.2%         20.4%          19.4%          17% **      24.05% ++         n
                              Six-Year Graduation Rate                                     38%          44.4%             54.9%         55%           42.2%         42.9%          47%            44% ***      43.33% +++       n
                              Number of Renowned Scholars (Marshall, Fulbright, Rhodes, etc.)  0           -                -             5             8             17             5             1              1             n
                              Number of National Fellowships                                0              -                -             5             3             12            10             5             3              n
                              Degrees Awarded by Fiscal Year                               1,726         2,481             4,618        2,700         1,673          1,798         1,907         1,766          1,987           n
                               Bachelor’s                                                 1,349          1,737            3,305         2,000         1,286          1,313         1,394         1,292          1,504           n
                               Master’s                                                    356           640               1,195        645            538           456           470            428           434             n
                               Doctorates                                                   21            40                86           55            29             40            43            46             49             n
                               STEM Disciplines                                            397           530               501          500            601           534           645            528           663             n

                            ATHLETIC SUCCESS
                              Number of MEAC Championships                                  0             NA               NA             5             1             0              2             3             4              n
                              Graduation Success Rates for Athletes                        50%           63.3%            76.6%         65%            56%           59%           63%            67%           68%             n

                            FINANCIAL RESOURCES
                              Endowment Market Value (millions)                           $24.01        $61.23            $131.02        $75           $34          $40.2          $48            $50            $51            n
                              Alumni Participation Rate                                     -              -               20%            -           8.8%          6.58%           8%            8%             8%             n
                            HUMAN CAPITAL (Faculty and Staff Recognition)
                              Number of Members in National Academies                       0              -                -             2            - ^            - ^            -             0             0              n
                              Number of Members Receiving National and International Awards  2             -                -             8            27             16            13             7             3              n
           n Above Target           Number of Endowed Professorships                        4              -                -             8            10             12             5             5             5              n
           n On Target           Highly Cited [Faculty] Staff [scholarly works
           n Below Target             Cited by more than 200 peers]                         0              -                -            10             41            27            28            25             20             n
           NA  Not Applicable
            -  Not Available
            ^  Revised Metric         RANKINGS AND RECOGNITION                                                                                                                                                                  n
            *  Entering F14           U.S. News Best College—Overal Rank (national universities)  Unranked  2nd Tier      1st Tier     1st Tier    Not Published   Unranked    Not Published  2nd Tier - RNP    RNP
           **  Entering F11          U.S. News Best College—Historically Black Colleges and
           ***  Entering F09            Universities Rank                                   12            NA               NA           TOP 5           11            8             10             10            10             n
            +   Entering F15
           ++   Entering F12  DIVERSITY
          +++   Entering F10    Student Demographic—Percent African American               87%           28%               21%          70%           85.4%          81.7%         80%           79.52%        77.77%           n
                              Student Demographic—Percent Non-African American             13%           72%               79%          30%           14.6%         18.2%          20%          20.48%         22.23%           n
                                                                                                                             North Carolina Agricultural and Technical State University (N.C.A&T) is accredited by the Southern Association of Colleges and Schools Commission on Colleges to award baccalaureate, master’s and
          [ 16 ]  NORTH CAROLINA A&T STATE UNIVERSITY                                                                        doctoral degrees.  |  N.C. A&T does not discriminate against any person on the basis of age, color, disability, gender identity, genetic information, national origin, race, religion, sex, sexual orientation,
                                                                                                                             veteran status, or any other basis protected by law.  |  N.C. A&T is an AA/EEO and ADA compliant institution.
   13   14   15   16   17   18   19   20