
Page 31 - Port of Stockton 2018 Annual Report
P. 31
A PORT’S JOURNEY || PAGE 29
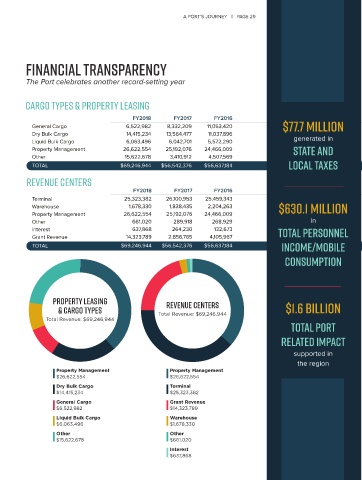
FINANCIAL TRANSPARENCY
The Port celebrates another record-setting year
CARGO TYPES & PROPERTY LEASING
FY2018 FY2017 FY2016
General Cargo 6,522,982 8,332,209 11,053,420 $77.7 million
Dry Bulk Cargo 14,415,234 13,564,477 11,037,896
Liquid Bulk Cargo 6,063,496 6,042,701 5,572,290 generated in
Property Management 26,622,554 25,192,076 24,466,009 STATE AND
Other 15,622,678 3,410,912 4,507,569
TOTAL $69,246,944 $56,542,376 $56,637,184 LOCAL TAXES
REVENUE CENTERS
FY2018 FY2017 FY2016
Terminal 25,323,382 26,100,953 25,459,343
Warehouse 1,678,330 1,838,435 2,204,263 $630.1 MILLION
Property Management 26,622,554 25,192,076 24,466,009
Other 661,020 289,918 268,929 in
Interest 637,868 264,230 132,673 TOTAL PERSONNEL
Grant Revenue 14,323,789 2,856,765 4,105,967
TOTAL $69,246,944 $56,542,376 $56,637,184 INCOME/MOBILE
CONSUMPTION
Property Leasing Revenue Centers
& Cargo Types Total Revenue: $69,246,944 $1.6 BILLION
Total Revenue: $69,246,944
TOTAL PORT
RELATED IMPACT
supported in
the region
Property Management Property Management
$26,622,554 $26,622,554
Dry Bulk Cargo Terminal
$14,415,234 $25,323,382
General Cargo Grant Revenue
$6,522,982 $14,323,789
Liquid Bulk Cargo Warehouse
$6,063,496 $1,678,330
Other Other
$15,622,678 $661,020
Interest
$637,868