
Page 114 - 2010-2022 hose manufactureing ability and guide
P. 114
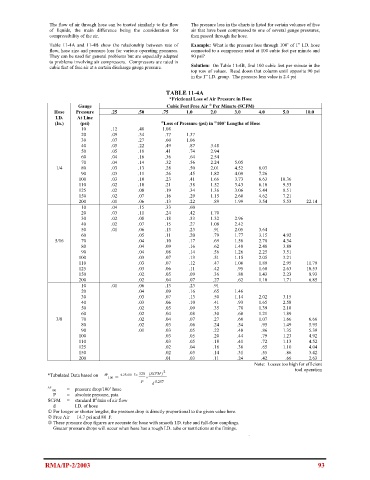
The flow of air through hose can be treated similarly to the flow   The pressure loss in the charts is listed for certain volumes of free
                 of  liquids, the  main difference being the  consideration for   air that have been compressed to one of several gauge pressures,
                 compressibility of the air.                    then passed through the hose.
                 Table  11-4A and 11-4B  show the relationship between rate  of   Example:  What is the pressure loss through 100’ of 1” I.D. hose
                 flow, hose size and pressure loss for various operating pressures.    connected to a compressor rated at 100 cubic feet per minute and
                 They can be used for general problems but are especially adapted   90 psi?
                 to problems involving air compressors.  Compressors are rated in
                 cubic feet of free air at a certain discharge gauge pressure.   Solution:   On Table 11-4B, find 100 cubic feet per minute in the
                                                                top row of values.  Read down that column until opposite 90 psi
                                                                in the 1” I.D. group.  The pressure loss value is 2.4 psi

                                                        TABLE 11-4A
                                                         *Frictional Loss of Air Pressure in Hose
                           Gauge                        Cubic Feet Free Air   Per Minute (SCFM)
                                                                      2
                   Hose   Pressure    .25      .50     .75     1.0     2.0     3.0     4.0     5.0    10.0
                   I.D.    At Line
                   (In.)    (psi)                     3 Loss of Pressure (psi) in  100’ Lengths of Hose
                                                                        1
                            10        .12      .48     1.08
                            20        .09      .34      .77    1.37
                            30        .07      .27      .60    1.06
                            40        .05      .22      .49     .87    3.48
                            50        .05      .18      .41     .74    2.94
                            60        .04      .16      .36     .64    2.54
                            70        .04      .14      .32     .56    2.24    5.05
                    1/4     80        .03      .13      .28     .50    2.01    4.52    8.03
                            90        .03      .11      .26     .45    1.82    4.09    7.26
                           100        .03      .10      .23     .41    1.66    3.73    6.63   10.36
                           110        .02      .10      .21     .38    1.52    3.43    6.10    9.53
                           125        .02      .08      .19     .34    1.36    3.06    5.44    8.51
                           150        .02      .07      .16     .29    1.15    2.60    4.62    7.21
                           200        .01      .06      .13     .22     .89    1.99    3.54    5.53   22.14
                            10        .04      .15      .33     .60
                            20        .03      .11      .24     .42    1.70
                            30        .02      .08      .18     .33    1.32    2.96
                            40        .02      .07      .15     .27    1.08    2.42
                            50        .01      .06      .13     .23     .91    2.05    3.64
                            60                 .05      .11     .20     .79    1.77    3.15    4.92
                   5/16     70                 .04      .10     .17     .69    1.56    2.78    4.34
                            80                 .04      .09     .16     .62    1.40    2.48    3.88
                            90                 .04      .08     .14     .56    1.26    2.25    3.51
                           100                 .03      .07     .13     .51    1.15    2.05    3.21
                           110                 .03      .07     .12     .47    1.06    1.89    2.95   11.79
                           125                 .03      .06     .11     .42    .95     1.68    2.63   10.53
                           150                 .02      .05     .09     .36    .80     1.43    2.23    8.93
                           200                 .02      .04     .07     .27    .62     1.10    1.71    6.85
                            10        .01      .06      .13     .23     .91
                            20                 .04      .09     .16     .65    1.46
                            30                 .03      .07     .13     .50    1.14    2.02    3.15
                            40                 .03      .06     .10     .41    .93     1.65    2.58
                            50                 .02      .05     .09     .35    .78     1.39    2.18
                            60                 .02      .04     .08     .30    .68     1.21    1.89
                    3/8     70                 .02      .04     .07     .27    .60     1.07    1.66    6.66
                            80                 .02      .03     .06     .24    .54     .95     1.49    5.95
                            90                 .01      .03     .05     .22    .48     .86     1.35    5.39
                           100                          .03     .05     .20    .44     .79     1.23    4.92
                           110                          .03     .05     .18    .41     .72     1.13    4.52
                           125                          .02     .04     .16    .36     .65     1.10    4.04
                           150                          .02     .03     .14    .31     .55     .86     3.42
                           200                          .01     .03     .11    .24     .42     .66     2.63
                                                                                     Note:  Losses too high for efficient
                                                       2                                           tool operation
                 *Tabulated Data based on    ∆Ρ 100 =  . 6  25× 10− 5×  520 ×  (SCFM )
                                                P  d  . 5 257

                 ∆P
                  100         =     pressure drop/100’ hose
                   P         =     absolute pressure, psia
                                 2
                 SCFM     =     standard ft /min of air flow
                   d         =     I.D. of hose
                   F
                 1 or longer or shorter lengths, the pressure drop is directly proportional to the given value here.
                 2 Free Air — 14.7 psi and 80  F.
                 3 These pressure drop figures are accurate for hose with smooth I.D. tube and full-flow couplings.
                   Greater pressure drops will occur when hose has a rough I.D. tube or restrictions at the fittings.
                                                                                   .


                RMA/IP-2/2003                                                                             93