
Page 65 - Microsoft Word - Bogra-01-Community-11
P. 65
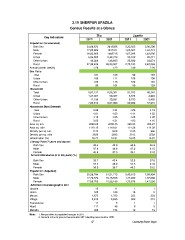
3.10 SHERPUR UPAZILA
                                Census Results at a Glance

               Key Indicators                 Zila                                           Upazila

Population (Enumerated)                 2011          2001                             2011           2001
    Both Sex
    Male                                34,00,874      3013035                         3,32,825       2,86,308
    Female                              17,08,806      1547341                         1,65,527       1,45,413
    Urban                               16,92,068      1465715                         1,67,298       1,40,895
    Other Urban                                        2,42,373
    Rural                                6,24,082      1,46,695                          25,152         22,371
                                            46,306    26,23,987                          28,930         23,074
Annual growth rate(%)                                                                  2,78,743       2,40,863
Sex Ratio                               27,30,486            1.22
                                               1.20                                         1.49           2.26
    Total
    Urban                                     101 106                                   99 103
    Other Urban                               109 111                                  100 109
    Rural                                     102 118                                  100 104
Household
    Total                                      99 104                                   99 103
    Urban
    Other Urban                         8,67,137      6,88,361                         81,753         68,346
    Rural                               1,47,921        50,367                          5,678          4,946
Household Size (General)                                30,091                          6,795          5,485
    Total                                 11,198
    Urban                               7,08,018      6,07,903                         69,280         57,915
    Other Urban
    Rural                                    3.88          4.34                           4.06           4.19
Area sq. km.                                 4.01          4.63                           4.41           4.52
Area sq. mile                                4.10          4.55                           4.25           4.20
Density per sq. km.                          3.85          4.31                           4.02           4.16
Density per sq. mile                    2898.68       2898.25                          295.93         296.27
Urbanization (%)                        1119.18       1119.01                          114.26         114.39
Literacy Rate (7 years and above)           1173          1040                           1125             966
    Both Sex                                3039          2693                           2913           2503
    Male                                   19.71         12.91                          16.25          15.87
    Female
 School Attendance (5 to 24 years) (%)        49.4 42.9                                43.0 36.3
                                              52.9 48.0                                47.0 41.5
                                              45.9 37.5                                39.1 31.0

    Both Sex                                   53.7          43.4                           52.8           37.6
    Male                                       57.5          46.9                           57.5           41.8
    Female                                     50.0          39.7                           48.3           33.5
Population (Adjusted)
    Both Sex                            35,39,294     31,51,715                        3,45,915       2,99,404
    Male                                17,78,529     16,18,555                        1,72,039       1,52,068
    Female                              17,60,765     15,33,160                        1,73,876       1,47,336
Administrative/Geographic Unit
Upazila                                           12            11                               1              1
Union                                           108           108                              10               9
Mauza                                        1,672         1,782                             223            224
Village                                      2,618         2,695                             322            319
Paurashava                                                                                                      1
Ward                                              11             5                               1              9
Mahalla                                         111             48                               9            19
                                                360           154                              19

Note: 1. Mauza refers to populated mauzas in 2011.
           2. General refers to general household in 2011 dwelling household in 2001.

                                        47                                                   Community Report: Bogra