
Page 839 - Microsoft Word - Bogra-01-Community-11
P. 839
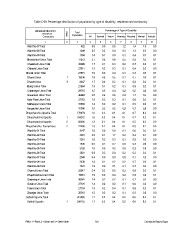
Table C-09: Percentage distribution of population by type of disability, residence and community

            Administrative Unit   RMO             Total                          Percentage of Type of Disability
                     Residence                 Population  All Speech Vision Hearing Physical Mental Autistic
                       Community
                                  23                       4 5 6 7 8 9 10
                         1
                                               422 5.0 0.0 0.5 1.2 1.4 1.9 0.0
 Ward No-07 Total
 Ward No-08 Total                              1049 2.5 0.2 0.4 0.3 1.3 0.3 0.0
 Ward No-09 Total
 Bhandarbari Union Total                       1394 1.4 0.1 0.0 0.1 0.4 0.7 0.1
 Chaukibari Union Total
 Chikashi Union Total                          17973 2.7 0.2 0.8 0.5 0.9 0.2 0.1
Dhunat Union Total
 Dhunat Union                                  30095 1.7 0.1 0.3 0.2 0.7 0.3 0.1
 Dhunat Union
 Elangi Union Total                            27811 1.3 0.2 0.3 0.1 0.4 0.2 0.0
 Gopalnagar Union Total
 Gosainbari Union Total                        27815 1.9 0.2 0.4 0.1 0.7 0.3 0.1
 Kaler Para Union Total
 Mathurapur Union Total           1 19348 1.9 0.2 0.5 0.1 0.7 0.3 0.1
 Nimgachhi Union Total
Dhupchanchia Upazila Total        3 8467 1.7 0.4 0.2 0.1 0.8 0.2 0.1
 Dhupchanchia Upazila
 Dhupchanchia Upazila                          21664 1.5 0.1 0.2 0.1 0.9 0.2 0.1
Dhupchanchia Paurashava
 Ward No-01 Total                              29710 1.5 0.3 0.4 0.2 0.5 0.2 0.0
 Ward No-02 Total
 Ward No-03 Total                              30983 2.5 0.2 0.6 0.3 1.1 0.2 0.0
 Ward No-04 Total
 Ward No-05 Total                              27163 1.5 0.2 0.3 0.1 0.6 0.2 0.1
 Ward No-06 Total
 Ward No-07 Total                              33888 1.4 0.2 0.2 0.1 0.5 0.2 0.1
 Ward No-08 Total
 Ward No-09 Total                              31096 1.5 0.2 0.2 0.2 0.7 0.2 0.0
 Chamrul Union Total
 Dhupchanchia Union Total                      176678 1.6 0.2 0.4 0.1 0.7 0.2 0.0
 Gobindapur Union Total
 Gunahar Union Total              1 154272 1.6 0.2 0.4 0.1 0.7 0.2 0.1
 Talora Union Total
 Zianagar Union Total             2 22406 1.3 0.1 0.4 0.1 0.5 0.2 0.0
Gabtali Upazila Total
 Gabtali Upazila                  2 22406 1.3 0.1 0.4 0.1 0.5 0.2 0.0

                                               3147 1.0 0.0 0.0 0.1 0.6 0.2 0.1

                                               3381 2.6 0.1 1.7 0.2 0.4 0.1 0.0

                                               3210 1.6 0.2 0.3 0.1 0.8 0.2 0.0

                                               1836 0.5 0.1 0.2 0.0 0.3 0.0 0.0

                                               2120 1.0 0.0 0.2 0.0 0.3 0.3 0.0

                                               2601 0.8 0.2 0.0 0.2 0.2 0.2 0.1

                                               2040 0.4 0.0 0.0 0.0 0.1 0.2 0.0

                                               2430 1.4 0.1 0.2 0.2 0.7 0.2 0.1

                                               1641 1.2 0.0 0.1 0.1 0.7 0.2 0.0

                                               28017 2.4 0.2 0.8 0.2 0.9 0.2 0.1

                                               19931 1.9 0.2 0.4 0.2 0.9 0.2 0.1

                                               30981 1.4 0.2 0.2 0.1 0.7 0.2 0.0

                                               27101 1.4 0.2 0.2 0.1 0.6 0.3 0.0

                                               27724 1.5 0.2 0.4 0.1 0.6 0.2 0.1

                                               20518 1.2 0.2 0.2 0.1 0.5 0.2 0.0

                                               319588 1.7 0.2 0.4 0.2 0.6 0.2 0.1

                                  1 298133 1.7 0.2 0.4 0.2 0.6 0.2 0.1

RMO: 1 = Rural, 2 = Urban and 3 = Other Urban              821  Community Report: Bogra