
Page 844 - Microsoft Word - Bogra-01-Community-11
P. 844
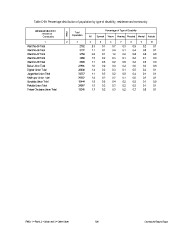
Table C-09: Percentage distribution of population by type of disability, residence and community

          Administrative Unit   RMO               Total                          Percentage of Type of Disability
                   Residence                   Population  All Speech Vision Hearing Physical Mental Autistic
                     Community
                                23                         4 5 6 7 8 9 10
                       1
                                               2762 2.3 0.1 0.7 0.3 0.9 0.2 0.1
Ward No-05 Total
Ward No-06 Total                               3232 1.1 0.1 0.4 0.1 0.4 0.0 0.1
Ward No-07 Total
Ward No-08 Total                               2750 2.8 0.1 1.2 0.2 0.8 0.5 0.0
Ward No-09 Total
Balua Union Total                              3060 1.5 0.2 0.3 0.1 0.8 0.1 0.0
Digdair Union Total
Jorgachha Union Total                          2380 1.1 0.3 0.2 0.0 0.2 0.3 0.0
Madhupur Union Total
Sonatala Union Total                           24885 1.6 0.2 0.3 0.2 0.6 0.2 0.0
Pakulla Union Total
Tekani Chukaina Union Total                    28808 1.4 0.2 0.3 0.1 0.5 0.2 0.1

                                               34357 1.1 0.3 0.2 0.0 0.4 0.1 0.1

                                               20362 1.4 0.2 0.2 0.1 0.6 0.2 0.1

                                               15444 1.5 0.2 0.4 0.2 0.5 0.1 0.0

                                               24957 1.5 0.2 0.3 0.2 0.5 0.1 0.1

                                               13245 1.7 0.2 0.3 0.2 0.7 0.2 0.1

RMO: 1 = Rural, 2 = Urban and 3 = Other Urban              826  Community Report: Bogra