
Page 1411 - (ISC)² CISSP Certified Information Systems Security Professional Official Study Guide
P. 1411
Initiating Initiating
Diagnosing Repeatable
Establishing Defined
Acting Managed
Learning Optimized
Gantt Charts and PERT
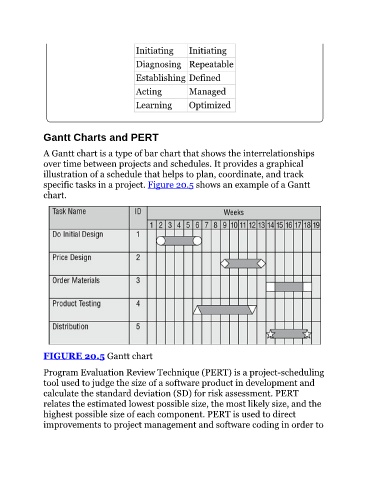
A Gantt chart is a type of bar chart that shows the interrelationships
over time between projects and schedules. It provides a graphical
illustration of a schedule that helps to plan, coordinate, and track
specific tasks in a project. Figure 20.5 shows an example of a Gantt
chart.
FIGURE 20.5 Gantt chart
Program Evaluation Review Technique (PERT) is a project-scheduling
tool used to judge the size of a software product in development and
calculate the standard deviation (SD) for risk assessment. PERT
relates the estimated lowest possible size, the most likely size, and the
highest possible size of each component. PERT is used to direct
improvements to project management and software coding in order to