
Page 247 - Math Smart - 7
P. 247
UNIT 11
Coordinate
Geometry
and Graphs Cape Town
You will learn about:
Reading and plotting coordinates in all four quadrants
Writing coordinate pairs that satisfy a linear equation
Plotting graphs corresponding to the linear equations
Recognising straight line graphs
Drawing and interpreting graphs in real life contexts
are exposed to a variety of data
jr everyday lives. A line graph '
I coordinate grid is a statistical Table Mountain
used In several Industries to ^ National Park
ent data effectively. Line graphs can ■xamptfl
:ate trends such as increase, decrease
0 change. For example, the changes in'
perature over a period of time. It Is useful ^
Camps Bay
»arn how to Interpret graphs accurately and
kly In order to understand data without
ng to process a large amount of numbers,
ket researchers, bankers, engineers, -f
■
itists and doctors use line graphs frequently
elp them Identify trends and formulating
erns. Graphs help them make sense of
data they have collected, and can also be
1 to predict future patterns and trends,
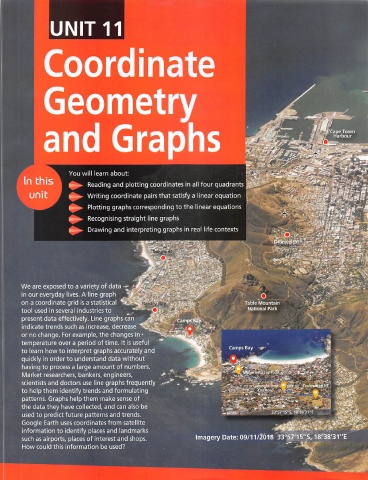
gie Earth uses coordinates from satellite
rmatlon to Identify places and landmarks
imagery
I as airports, places of interest and shops.
j could this information be used?