
Page 271 - Math Smart - 7
P. 271
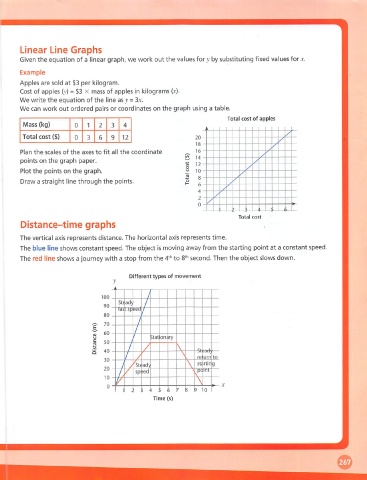
Linear Line Graphs
       Given the equation of a linear graph, we work out the values for by substituting fixed values for x.
       Example
       Apples are sold at $3 per kilogram.
       Cost of apples iy) = $3 x mass of apples in kilograms U).
       We write the equation of the line as y = 3x
       We can work out ordered pairs or coordinates on the graph using a table.
                                                                           Total cost of apples
        Mass (kg)        0   1   2   3   4
        Total cost ($)   0   3   6   9  12                      20
                                                                18                       /
                                                                                        /
       Plan the scales of the axes to fit all the coordinate    16                     /
                                                                14
        points on the graph paper.                                                 /
                                                                12
       Plot the points on the graph.                            10
                                                                 8
        Draw a straight line through the points.
                                                                 6
                                                                 4
                                                                      /
                                                                 2
                                                                 0
                                                                                            —<>—
                                                                              Total cost
        Distance-time graphs

       The vertical axis represents distance. The horizontal axis represents time.
       The blue line shows constant speed. The object is moving away from the starting point at a constant speed.
       The red line shows a journey with a stop from the 4*^ to 8'^ second. Then the object slows down.


                                           Different types of movement


                                  100
                                       stf ad)  /
                                  90
                                       fastspeed /
                                  80
                                             /
                                   70
                                            /
                                  60
                                            /
                                                  >tat oni  ry
                                   50       1
                                          / /             \
                                  40
                                         / /                     re urn to
                                   30
                                        /   ^St(ad)              st< rtin 9
                                   20                              ml
                                   10 /      spjed              C
                                         /
                                                                 \
                                   0
                                         1           i  >    i     0
                                                   Time (s)