Page 389 - Math Smart - 7
P. 389

UNIT 17


                        You will learn about:
                              The mode (or modal class for grouped data), median and
                              range
                              Calculating the mean
                              Comparing two simple distributions using the range and the
                              mode, median or mean
                              Drawing and interpreting
                             • bar-line graphs
                             • bar charts
                             • frequency diagrams for grouped discrete data
                             • pictograms
                             • pie charts
                              Drawing conclusions based on the shape of graphs and
                              simple statistics
                              Drawing conclusions based on simple statistics.
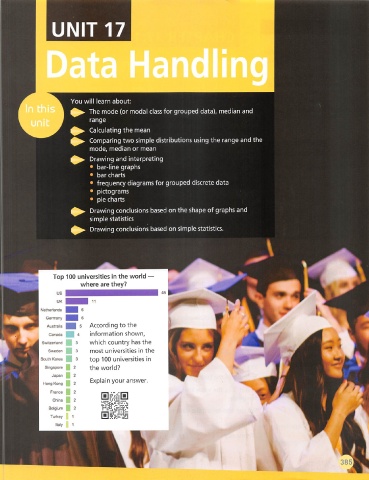


                   us
                   UK
              Netherlands
                Germany
                              According to the
                Australia
                              information shown,
                 Cartada
              Switzerland     which country has the
                Sweden        most universities in the
              South Korea     top 100 universities in
               Singapore      the world?
                  Japan
                              Explain your answer.
               Hong Kong
                 France
                  China
                 Belgium
                                    irt  .r.i.r.**
                 Turkey             in  m-i
                   Italy
   384   385   386   387   388   389   390   391   392   393   394